
In a small series, we will describe the approach in our projects along our data value chain. The series of articles consists of three parts: "Data Purpose and Data Visualization," "Data Transformation and Data Analysis", and "Data Collection". zipcon consulting, one of the leading consulting firms in the print and media industry in the German-speaking world, asked us to outline the approach for a medium-sized print shop from the perspective of data experts.
In many print shops, financial accounting and the ERP system provide the data needed to manage a company. In many cases, the printing industry has standard reports for the key performance indicators (KPI). If you want to go beyond that and create additional value from the data, then you need experts for data visualization and analysis.
At the beginning of a data project, there is often a demand for more transparency in decisions that were previously made primarily on the basis of experience and intuition. Whether it is the processing of circulation data, the monitoring of printing processes or the analysis of data volumes and loading processes – the process structure follows a recurring model, for which we have coined the term Data Value Chain: A standardized and proven framework for almost all projects at M2.
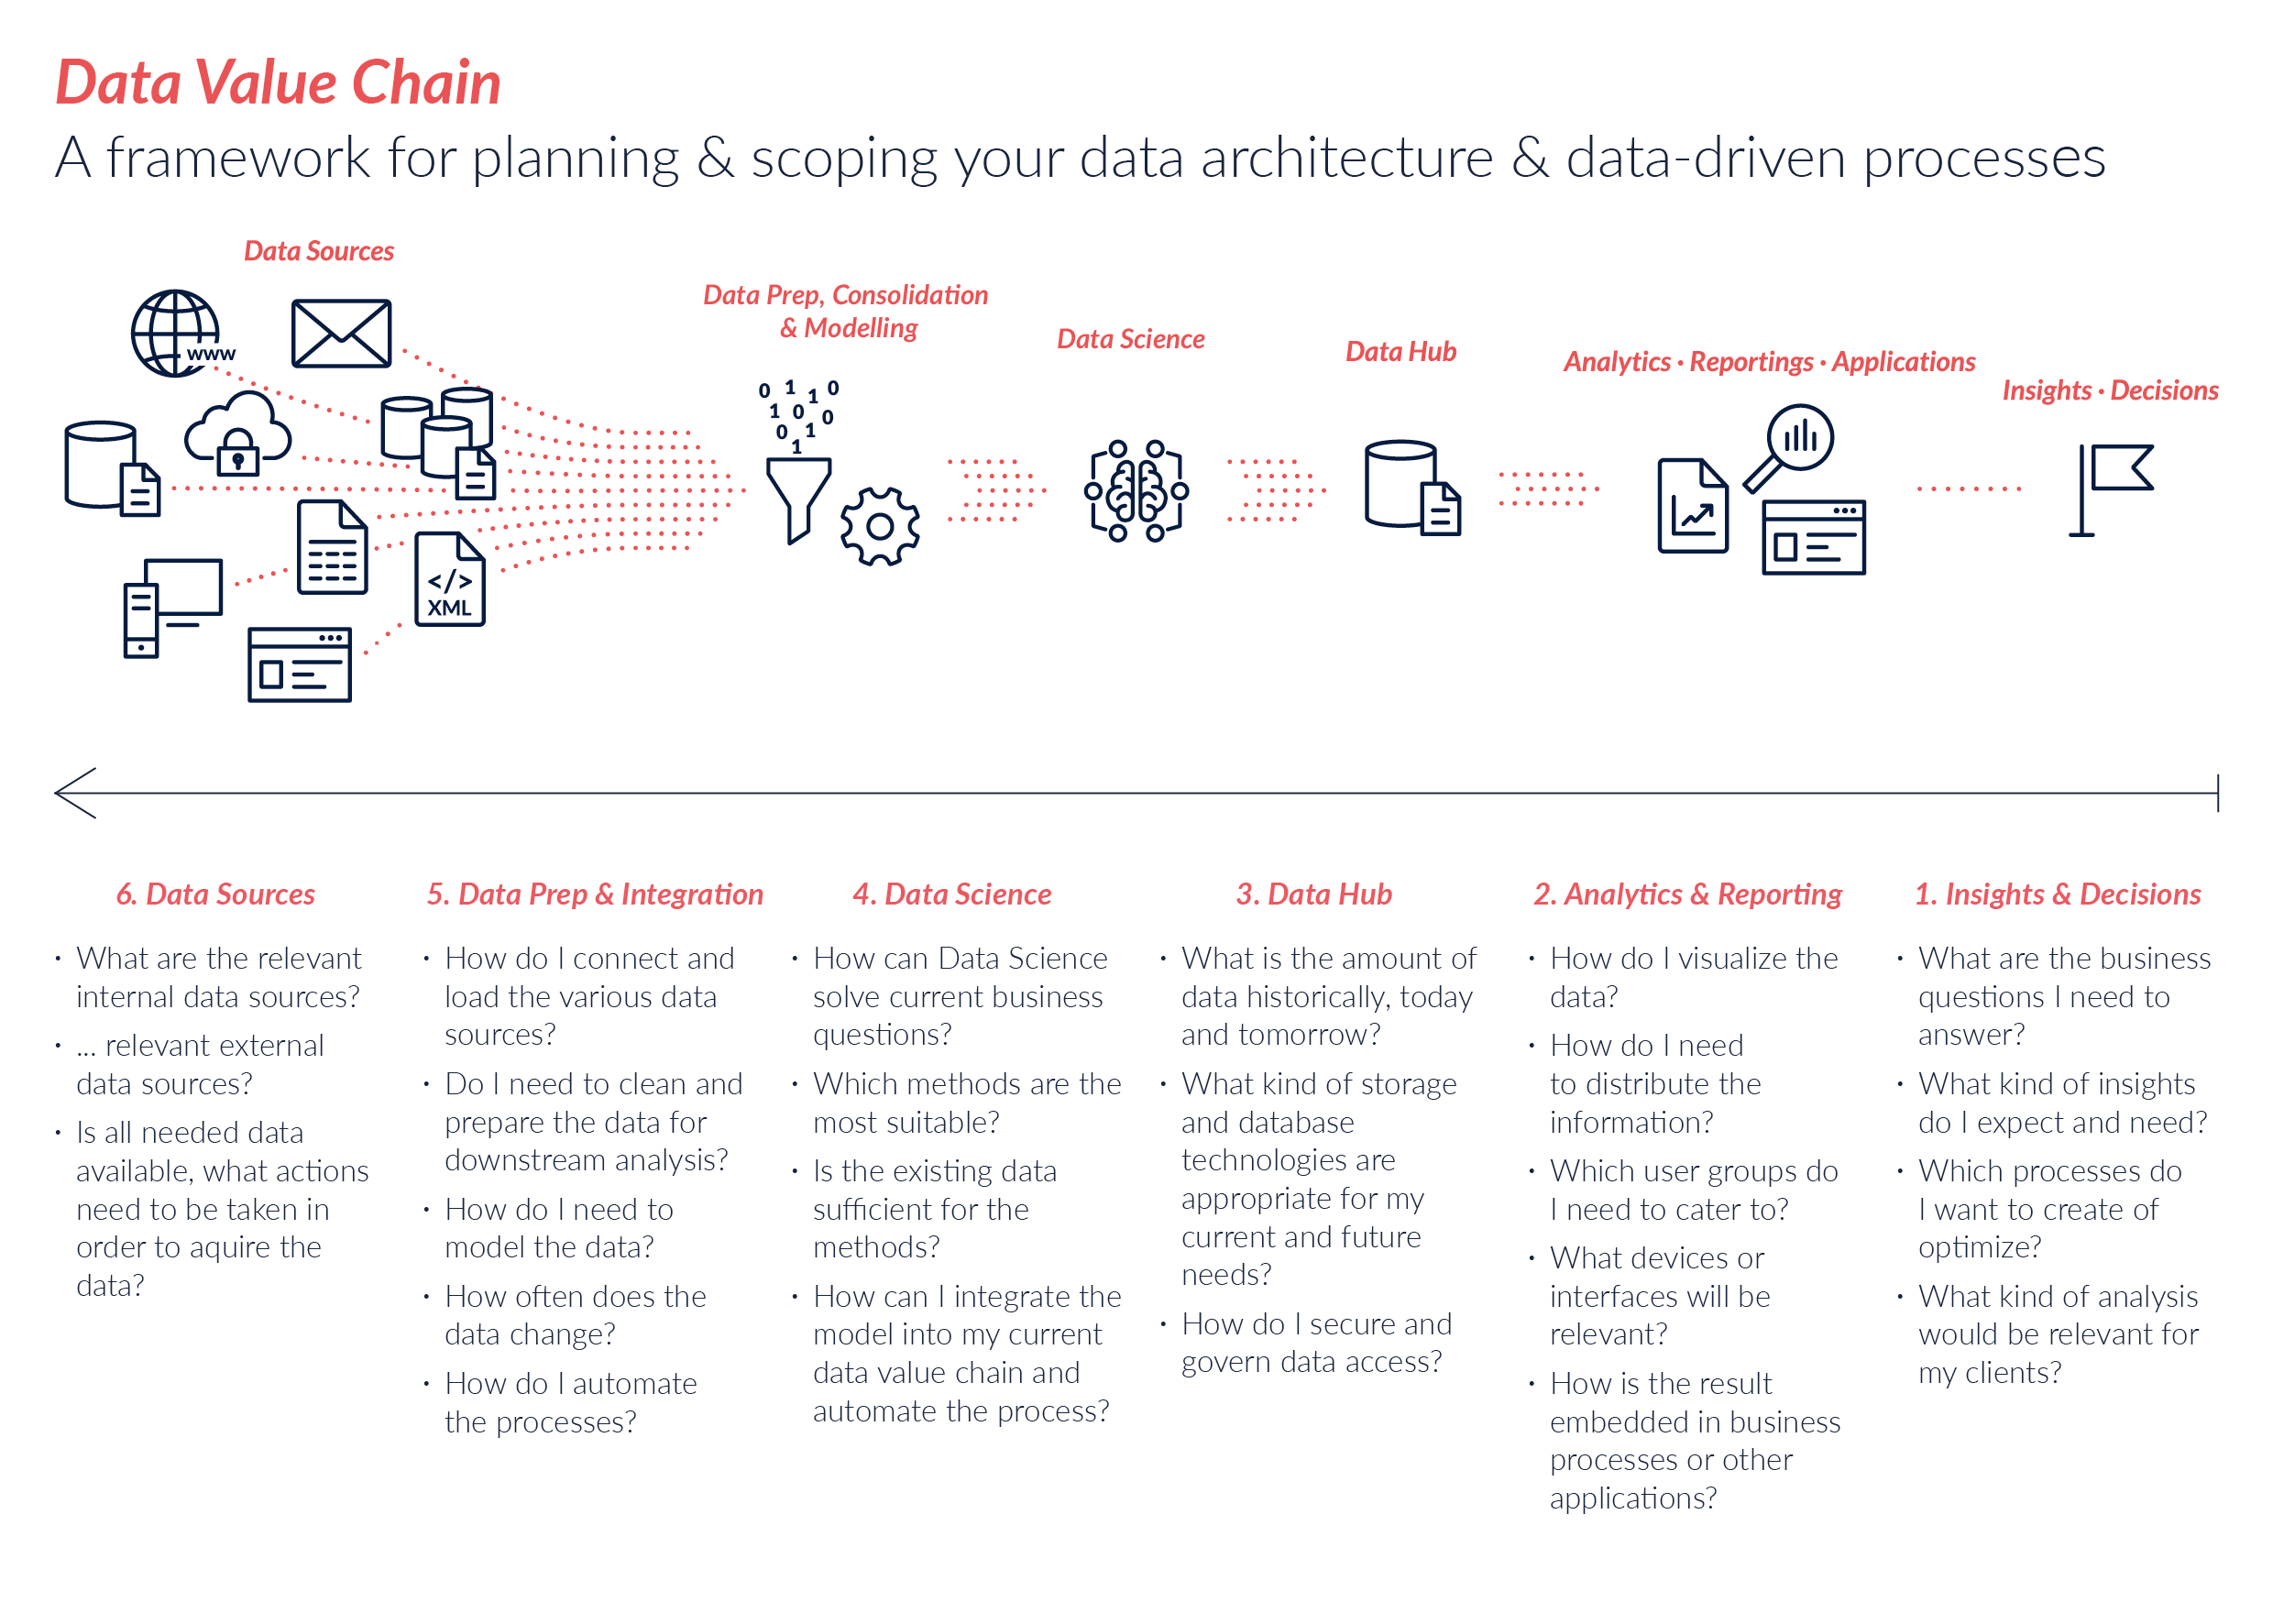
The data value chain is read from right to left. The following steps are defined along this chain:
- Insights & Decisions
- Analytics & Reporting
- Data Hub
- Data Science
- Data Prep & Integration
- Data Sources
The first step involves the following questions: What decision should be made? Which process should be optimized?
In step two, we want to find out which chart types can answer these questions.
In step three, four and five we are to find out: What data model underlies this view? What data modeling techniques need to be applied?
In the final step, we address the question of which systems need to collect the data and which data needs to be integrated.
On the data value chain diagram above, we list the questions below the diagram that will be asked at each stage of the project. The answers to these questions are essential. They help us identify the tasks and plan the project.
The data value chain process is explained below using a fictitious XY print shop with 100 employees.
Insights & Decisions
The process in the data value chain starts with business questions. For example: How many print shops are real competitors, how many potential customers are there, what do customers want to achieve, in what quantity do customers want to purchase a product, do customers respond to new trends – this knowledge is a basic prerequisite for the print shop’s survival.
To make our example tangible using the data value chain, we make the following assumption:
Our print shop wants to create a digital report in the form of an interactive dashboard. The dashboard is created for the company’s management. In doing so, the print shop would like to answer the following question:
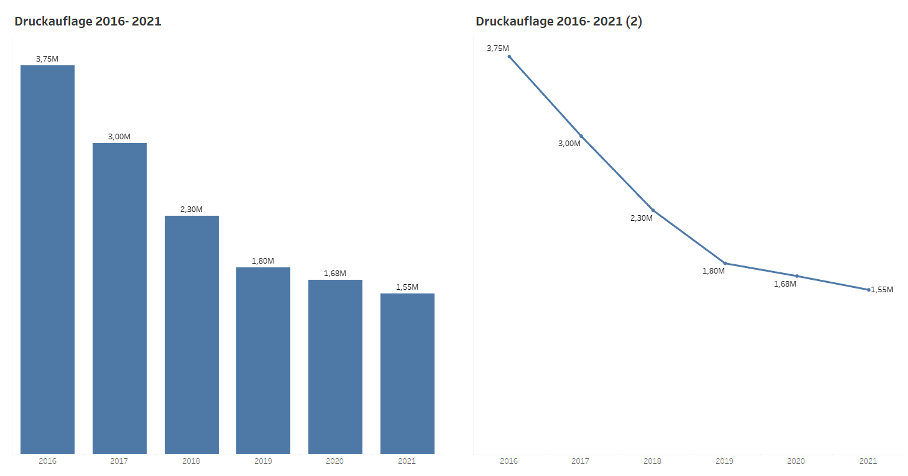
In what quantity were print products such as brochures, flyers or postcards produced in Germany in the past five years (2016 – 2021)?
Based on this information, the print shop would like to find out how strongly the pandemic situation has influenced the print run.
The answers to these questions are relevant for different operating scenarios. They can have a significant influence on adjustments to production processes or the planning of work resources.
Analyzing this data is not just about finding the answers to these questions. It is also about understanding which technologies could support the business at each step of the data value chain.
Analytics & Reporting
How do I visualize the data?
The number of printed products over the last five years can be visualized as a line chart. If, on the other hand, I want to compare years with each other, a bar chart is more suitable.
Knowledge about diagram types is essential here. The question plays an important role. You have to formulate the message precisely in order to select the right diagram type.
The Visual Vocabulary from Financial Time offers valuable assistance https://ft-interactive.github.io/visual-vocabulary/
The Visual Vocabulary is a great help in choosing diagrams if you are not very familiar with the topic of data visualization.
Who are my users?
In addition to the question of visualization type, I equally need to know who will consume the dashboard in the future. In our example, it is the management of the company. The information about our user and end user is extremely important. Based on this, the context in the dashboard is created. Support text and explanations on the dashboard should include metrics and definitions that are relevant to the target audience.
If we had the marketing department as the target audience, we would have to work with marketing metrics. Each department looks at information from a different angle. Although we are often talking about identical numbers, different departments will interpret the numbers very differently.

Which end devices are relevant?
At M2 we have chosen Tableau Software. Tableau Software is a widely used software for data visualization, data analysis and data management.
The dashboards are created using Tableau Desktop. While creating dashboards in all the initial steps, one must also know the purpose of the dashboard. A dashboard can be used in many ways:
- Interactive on the web page.
- Printed out, on paper
- As information in a presentation
- As an embedded version (that is, the dashboard is published in a blog article on a web page)
- Interactive on a tablet
- Interactive on a smartphone
Knowing this information, you should choose the size of the dashboard accordingly when creating it.
Tableau provides the ability to build dashboards intuitively and share those results with colleagues.
Who can access the dashboard?
Companies today have a large amount of data that is often very sensitive. There is data that we are not allowed to share or do not want to share. So the question is: Who is allowed to access my dashboard? This question should be asked at the very beginning of the creation process.
In our example, printing company XY would like to make the key figures of the print run known only at the management level for the time being. So in this case, the dashboard should only be accessible to certain people in the company.
Tableau Server provides the ability to share such content for specific groups and manage access permissions accordingly.
How should data be analysed?
Data analysis in itself is an extensive field that requires a lot of knowledge and experience. It is not for nothing that the profession of data analyst exists.
To illustrate, we will simplify this step in the data value chain. In our example, we are dealing with a key figure: the print run. We need this metric in aggregate form for the years 2016 to 2021.
Understanding data aggregation is very important. In everyday life, we often deal with aggregated figures, but not everyone is really aware of this.
Data aggregation is a method of collecting and summarizing data in a billing data set that is otherwise presented with multiple data sets. So data can be summed and presented at different levels of aggregation.
If we are looking at the 2021 print run metric, we need to know how that number is composed and what elements are added together to give us a total unit count of 3.7 million.
The following example shows how the raw data can be added together at different aggregation levels.
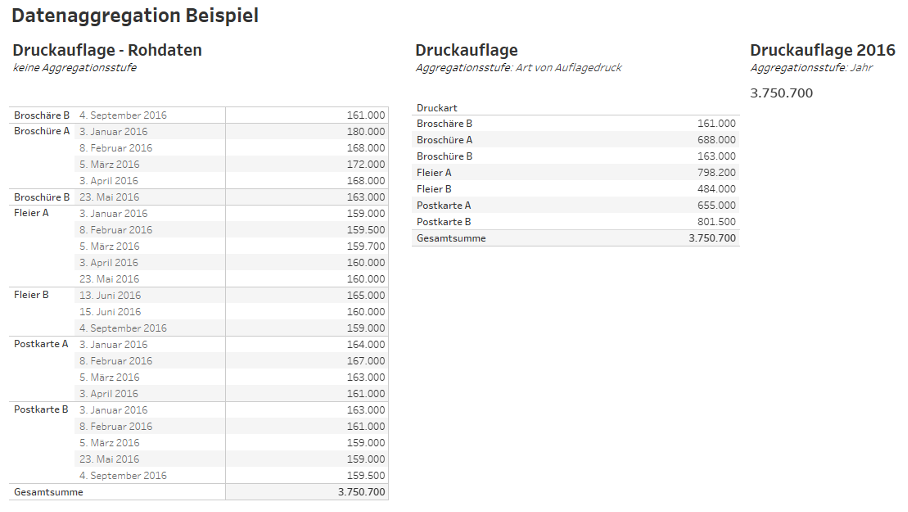
Data aggregation can be applied at any size, from simple tables to data lakes. This allows information to be aggregated and conclusions to be drawn based on data-driven insights.
In data analytics, the goal is to identify interesting trends and patterns in the data. Exploratory analysis and descriptive statistics play a central role in this process.
Exploratory data analysis is about exploring the data to understand its context. This step involves creating different types of graphs that are not necessarily communicated to end users.
Descriptive statistics help describe the data. Measures such as standard deviation, arithmetic means, correlations, or linear regressions help us interpret data correctly and understand relationships.
We have reached the end of the second step: Analytics & Reporting. The next part will be about Data Hub and Data Science.
Find the second part of this series here – you will learn more about the next steps Data Hub and Data Science on our data value chain.
info@m2dot.com · M2@Facebook · M2@Twitter · M2@LinkedIn · M2@Instagram