

written by Dilyana Bossenz, Business Intelligence Consultant
Relationships: Tableau's new data model at a glance
In Tableau Version 2020.2, a new data model with relationships was introduced, which makes our work with data easier, but requires new thinking. In this blog article, we have briefly summarized the most relevant points for you so that you know what to consider with the new data model. The data set used for this blog article can be found here.
What is the new data model?
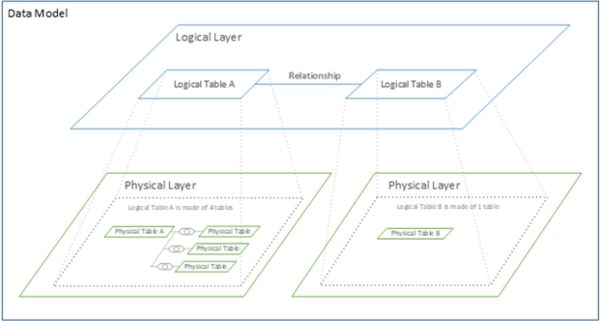
The new data model includes logical and physical levels, which can be seen in Tableau on the "Data Source" page.
The physical level is already known from Tableau 2020.1 and lower versions. If necessary, several tables can be merged into one physical table using data joins or unions.
The new logical level forms the relationships, or "Relationships", between these physical tables.
What are Relationships?
With Relationships, you create a relationship between several tables by defining which columns (fields) these tables have in common.
Relationships create a flexible data source with several separate tables. This is the main difference to data joins or data blending, where several tables are permanently merged into one table. By maintaining the separate tables in Relationship, Tableau can more easily see which field is from which table. This means that each field retains its context or level of detail. In addition, the granularity of the data is reprocessed every time, depending on which dimensions and key figures are used in a chart. We no longer have to worry about the granularity of the data in advance, as is the case with data joins or data blends. It happens automatically as soon as we create a chart.
What is to be considered?
Data source
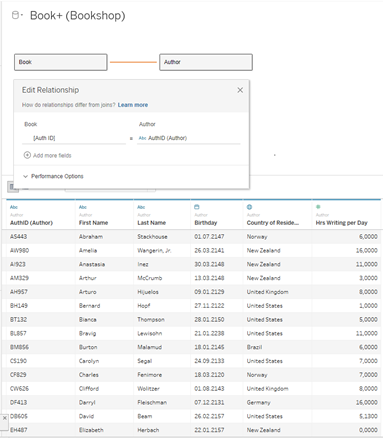
When you open Tableau 2020.2 (and higher) and drag two tables onto the work area, a relationship is automatically created between the tables. Where possible, this is done via a common column (key).

In the lower area you can see the table that is currently selected in the work area. A table that consists of several tables is no longer displayed.
Dimensions/Measures
There are also changes in the work area of a worksheet. On the left side there are three blocks in this case:
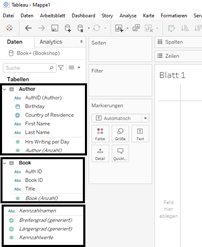
In the block above and in the middle we see our two tables with the dimensions and key figures. The dimensions and measures are separated by a line. In the lower block we see dimensions and measures that are automatically generated by Tableau. These include: key figure names and figure values, as well as longitude and latitude (generated). Sets and groups created will automatically appear in the tables on which they are based.
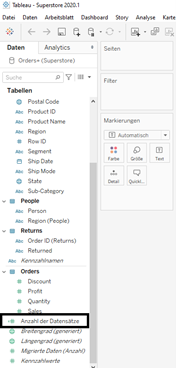
Number of records
The key figure "Number of data records" is now displayed differently. Each table has its own number of records, which is named differently: table name (number).
The reason for the separation between the tables is that the original idea with the common key figure “number of data records” no longer works, because: With relationships we consider each table separately. Each table has its own granularity and level of detail. Each table therefore has its own key figure table name (number).
In addition, this key figure is now aggregated. Here's what we see when we create a calculated field with this measure:
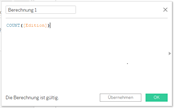
If you used this metric in your data visualization and created it in an earlier version of Tableau, this is not a problem. The metric is retained. Here we can see an example: I created a workbook in Tableau 2020.1 where I used the measure "number of records".
Calculated Fields
The behavior of the calculated fields must also be observed.
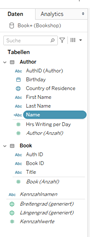
When a dimension is created as a calculated field with dimensions and measures from Table A, it will appear in Table A under Dimensions
Example: Author table
Field name: Name
[First Name]+" "+[Last Name]
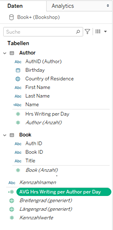
If a measure is created as a calculated field with dimensions and measures from Table A, it will appear in the "Neutral Block" below
Example: Author table
Field name: AVG Hrs Writing per Author per Day
sum([Hrs Writing per Day])/COUNT([Author])
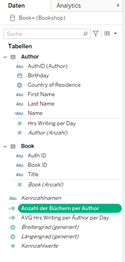
If a measure / dimension is created as a calculated field with dimensions and measures from several tables, it will also appear in the "neutral block" below
Example: Author and Book table
Field name: Anzahl der Bücher per Author
COUNT([Book])/COUNT([Author])
All data records at a glance
Before updating on Relationships, it was necessary to consider in advance which join type was the right one for combining dimensions and key figures from several tables. Some joins could lose data. This problem does not exist with relationships. All data is displayed, no information is lost.
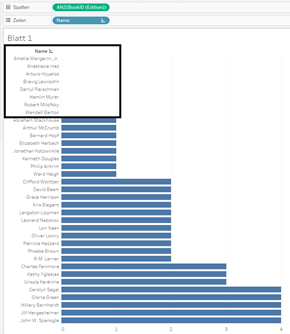
Here is an example: I want to know how many books (table Book) a certain author (table Author) has written. To answer this question with joins, I have to try the joins in advance and think about how to get this answer.
The approach to relationships is different. I just drag the authors' names into the row and the number of books into the column and I have my answer straight away. I can even see which authors have no entries. This is exactly what makes Relationships interesting, because you can now proceed completely differently when analyzing data. You simply see more information: Authors who have no entries. This information is no longer lost.

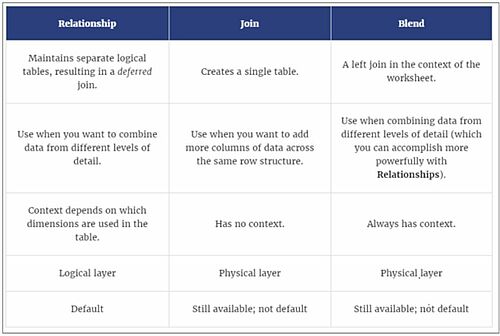
Relationship / Data Join / Data Blending
Here is an overview that shows the differences between Relationship, Data Join and Data Blending.

Extract
There are also new options for data extraction: the logical and the physical table.
Option: logical table
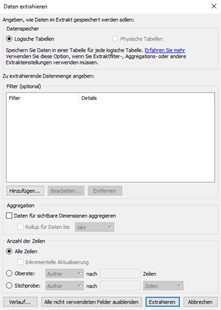
Use the logical option if you want to reduce the amount of data in the extract. You can choose from the following options:
- Extract filter
- Aggregations
- Top N
- More options
You should also use this option if you are using the RAWSQL function.
If you are unsure which option to use when extracting the data, just always select this option.
With the "Logical tables" option, all tables are extracted from the logical level:
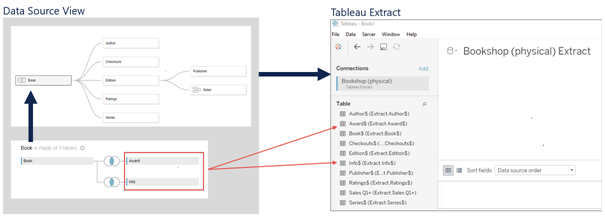
Option: physical table
Use this option if your table meets the following requirements:
- All join types are connected to one another with the "=" sign
- The data types for Relationships and Data Join are identical
- No use of RAWSQL is necessary
- No incremental data update is set or necessary
- No filters are necessary on the data extract
- No Top N or sample should be applied to the data set
It is also advisable to use the Physical Table option if you have determined that the extract is larger than it should be. This occurs when the number of all records in the extract that you created with the "Logical Table" option is greater than the number of records in the physical table (before the extract).
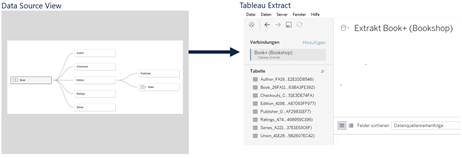
With the option "Physical tables", all tables are extracted from the logical and physical level
Do you have any questions about Tableau or basically about data visualization? Then feel free to contact us at any time.
We look forward to exchanging ideas with you!
Your M2 Team
+49 30 2089870 10
info@m2dot.com · M2@Facebook · M2@Twitter · M2@LinkedIn · M2@Instagram