
Using the example of our joint project with LV 1871, we will show you how you can use Tableau comfortably as a planning and monitoring tool using the Form Builder developed by M2.
Our Partner
![]()
The Lebensversicherung von 1871 ("Life Insurance of 1871 a. G. München", LV 1871) is a specialist for innovative occupational disability insurance as well as life and pension insurance. Around 470 employees work in the heart of Munich for the financially strong and just as modern as traditional insurance company.
Initial situation & targets
The Controlling team is responsible for the planning and monitoring process. Until now, two different tools have been used for planning and monitoring. The objective was to reduce the maintenance effort and increase the usability for the users through an integrated solution for material cost and investment planning, i.e. mapping in one tool.
Methodology and project scope
A user survey of the previous planning tool was conducted and the requirements for the new planning and monitoring tool were worked out in consideration of the customer journey. Based on this, a functional concept was developed and the tool was selected. The implementation team on the part of LV 1871 consisted of the controlling team and one colleague each from the data science and data engineering team.
A two-step approach was chosen for the implementation. First, a four-week proof of concept was carried out in May 2020. This was followed by further development to a minimum viable product in around five weeks.
Implementation
On the basis of the technical concept, a tool was developed as a minimum viable product in joint sessions as part of a proof of concept, which, in addition to extensive analysis options, also allows the input of forecast and planning values. This was realized by a Tableau dashboard in combination with the Form Builder. Afterwards, the results were presented to selected users and the tool was further developed in further sessions for pilot use in corporate planning, taking into account the feedback received.
The result
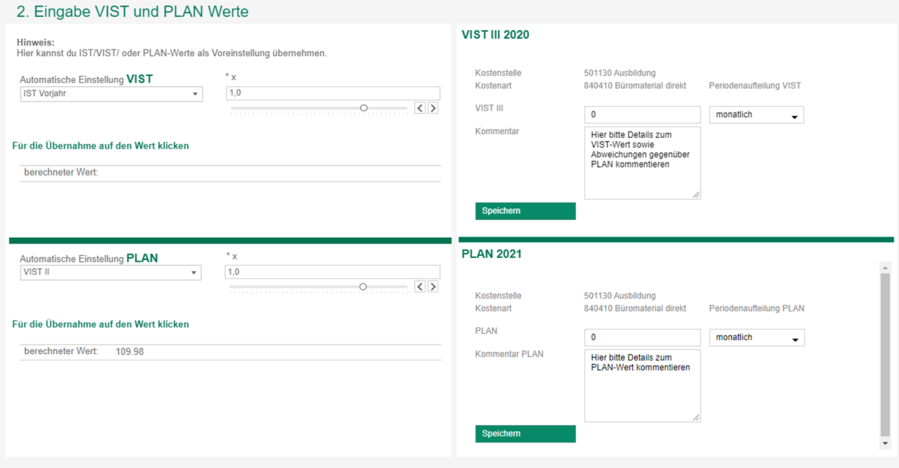
The implemented solution consists of two analysis and input dashboards for material costs or investments as well as two result reports.
Below you can see the developed input mask for the forecast and plan values. This consists of the M2 form (right), which can be filled either manually or automatically with default values determined by the table (left).
Further customer stories and exciting case studies from our project work can be found here
Do you have questions about the Form Builder, Tableau or our project work?
Then you are welcome to contact us at any time.
We look forward to the exchange with you!
Your M2 Team
+49 30 2089870 10
info@m2dot.com · M2@Facebook · M2@Twitter · M2@LinkedIn · M2@Instagram