Data visualization and dashboard design are among the topics Christoph Maurer is responsible for in his role as Visual Design Lead at M2. Christoph has been working at M2 since 2017. We talked to him in detail about the appeal and challenges of his creative role in the M2 team.
We present an excerpt of our conversation here. You can read the entire conversation and further staff interviews here.
M2 editorial team: Hello Christoph! Thanks a lot in advance for the interview with you. First of all of course the question, what are you doing at M2?
Christoph: I am a Data Visualization Specialist. That sounds a bit pretentious now, but basically I'm responsible for visualizations, layout and graphic design. More specifically, I do template and dashboard design for Tableau dashboards. This means that I find a layout and structure for the dashboards and their content. I also think about how to incorporate the CI (Corporate Identity) of the customer and finally make the visualization understandable. Concretely, one could summarize my work step like this: How do I get from the questions asked to the data to a reasonable and understandable visualization? In addition, I am responsible for the company communication. This includes flyer design, website support and whitepaper design. And every now and then I dedicate myself to the field of cultural analytics, which we use for the artistic representation of data, i.e. data art.
"The creative moments of trying out designs and realizing that some visualizations work better than others really appeal to me."
M2 editorial team: At which interfaces are you connected to the customers?
Christoph: I am often involved in the work at the beginning of a project. It is discussed what exactly should be visualized and I make the first sketches ("mockups") for this. With the help of these sketches you can already estimate which information you need and the visualization becomes very tangible for the customer. The mockups are created by me before the dashboards are built.
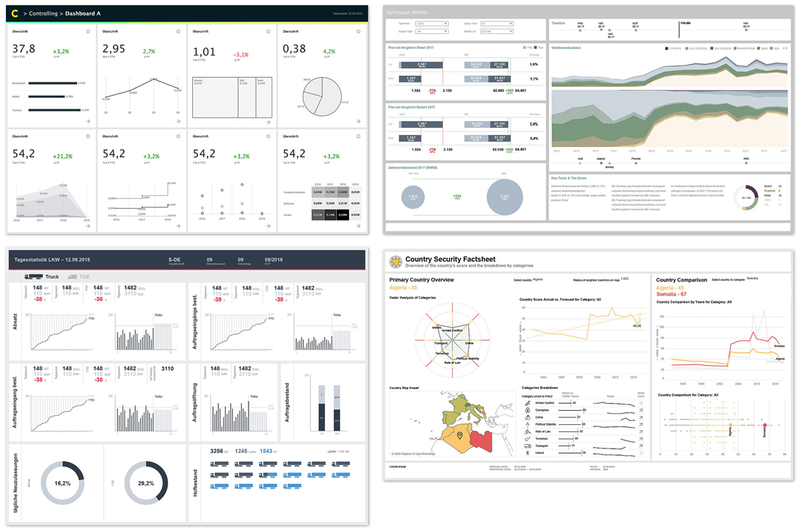
Some examples from the work with and for our customers. More examples can be found here.
M2 editorial team: What drives you in your work or what attracts you the most?
Christoph: This is already the whole topic of visualization. Often I am not even clear about what the final result will look like. But the creative moments when you try out designs and realize that some visualizations work better than others, I find very appealing. But I also love moments of insight, where you get interesting insights into data structures that you didn't have before.
You can read the entire interview and further employee interviews here.
Do you have questions about dashboard design or the optimal visualization of data? Then take a look at our Visual Design page and download the free whitepaper Dashboard Design.
Feel free to contact us at any time if there are any further questions about visual design that we can help you with.
We look forward to the exchange with you!
Your M2 Team
+49 30 2089870 10
info@m2dot.com · M2@Facebook · M2@Twitter · M2@LinkedIn · M2@Instagram

![[Translate to English:] [Translate to English:]](/fileadmin/user_upload/FWUChristoph_Maurer_Portrait.jpg)
