Reference examples from our service and product portfolio demonstrate the consulting and implementation competence of M2. On our Customer Stories page we have summarized various customer projects. Here we show a short project review with our partner ECFR.
Initial situation & goal
The raw data from cross-national surveys and qualitative researches were manually transferred into tabular formats and static representations with high time and cost input. A new project approach was to be developed for faster analysis of the results and flexible visualization. In the past, weeks used to pass between data collection and evaluation. The aim was to enable ECFR's analysts to access the elaborately compiled information during the survey phase and to make it available to a wide audience in a timely manner.
Procedure
Using the questionnaires used by ECFR for the surveys, our consultants developed a data model in Tableau Prep Builder that was optimized for visual analysis. Thanks to its flexibility, the next step was to start creating analysis views in Tableau Desktop. The ECFR team was thus able to prepare its analyses and publications optimally for publication and communication at an early stage. The finished visualizations were made available to the general public via Tableau Public.
The customer
The European Council on Foreign Relations (ECFR) is an award-winning international think tank with offices in seven European capitals and a strong focus on data-driven international cooperation projects. In the project Rethink: Europe project funded by the Mercator Foundation, ECFR regularly conducts complex, transnational expert surveys throughout Europe. The results are published in freely accessible analyses and data visualizations. In a number of countries they serve as impulses for political decision-making and negotiation processes as well as for social discourse.
The result
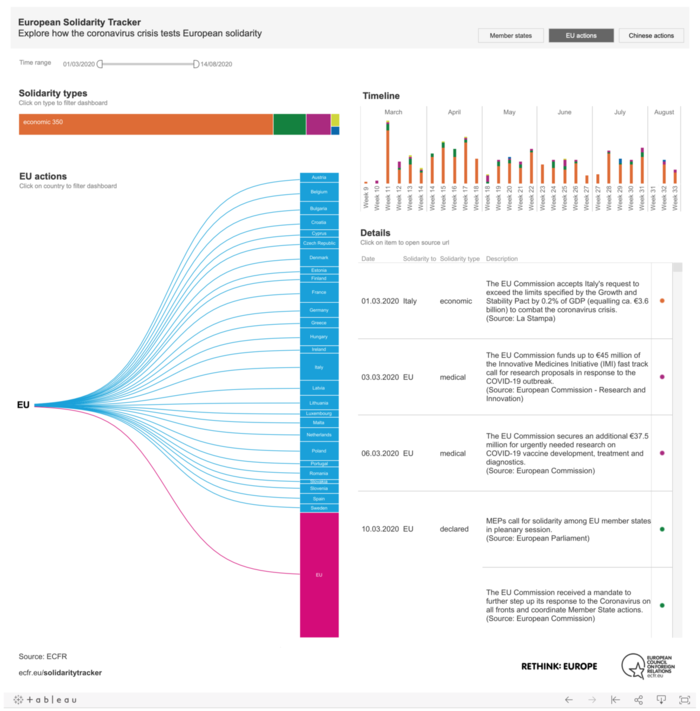
The added value achieved in the project ranges from efficient raw data structuring to flexible visualization. Important aspects are simplification, streamlining and flexibility. In addition to the considerable savings in time and effort, a further added value lies in the enhancement of existing publication formats through interactive result views and the possibility of curating them precisely for different target groups. Examples are the European Solidarity Tracker and the EU Coalition Explorer, which were published in June 2020. The developed project approach can be easily transferred to other survey projects by the client, thus creating synergies beyond the actual context of the assignment.
You can find a complete overview of all customer stories here
Do you have questions about one of our customer projects or basically about data visualization? Then you are welcome to contact us at any time.
We look forward to the exchange with you!
Your M2 Team
+49 30 2089870 10
info@m2dot.com · M2@Facebook · M2@Twitter · M2@LinkedIn · M2@Instagram

