Data value creation shouldn’t be over complex or costly. M2. consulting for a joint project by the European Council on Foreign Relations (ECFR) and the Mercator Foundation shows how time is saved and value added even without a large infrastructure or complex processes.

Article by Christoph Klavehn, Business Intelligence Consultant
Once a year ECFR compares EU member state cooperation with the help of a uniquely curated data set. The study stands out for using only publicly accessible sources. It includes survey data from the European Parliament, figures from the European statistical office Eurostat as well as research from universities and think tanks such as the ECFR itself or the International Institute for Strategic Studies.
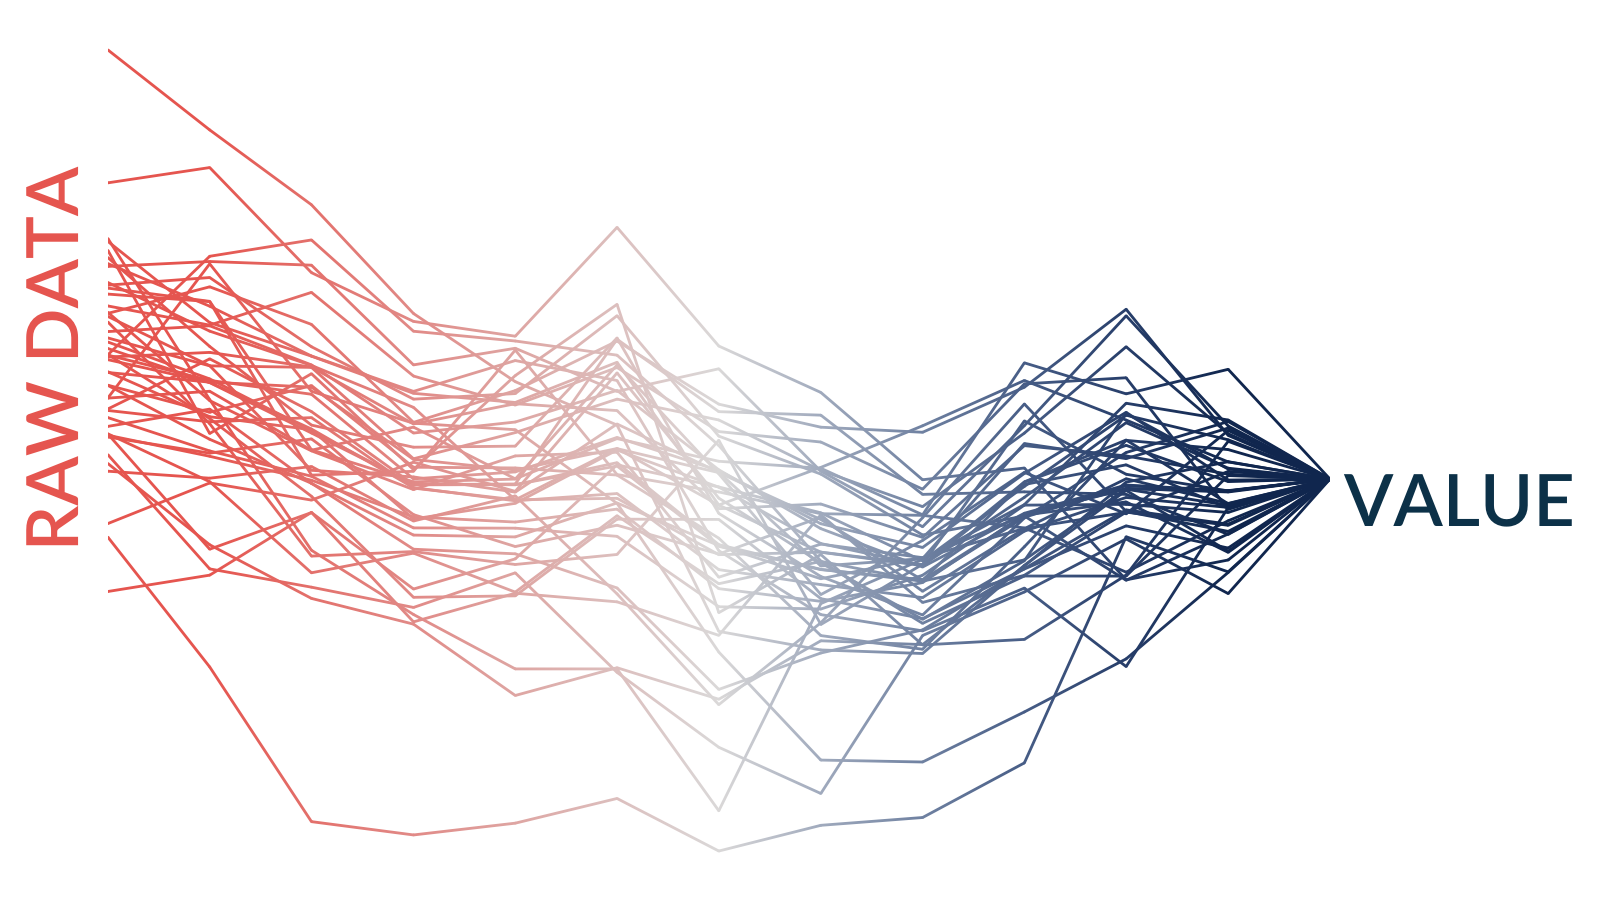
In total, more than 40 KPIs are brought together in ECFR's data monitor. The project team collects this data to compile a time series covering the years since 2007 for all 28 EU member states. In the next step, the raw data is run though a normalization model to enable structured analysis of this vast amount of raw inputs. This is done by scaling the various measures – percentages, Euros, quantities, etc. – into values that can be directly compared across time and categories. In addition, individual data points are aggregated to form indicators and country groups.
The core challenge in such a project is not to lose sight of its intended goal.
The core challenge in such a project is not to lose sight of its intended goal. Having meticulously collected a trove of data, the project team should be given as much time as possible for analysis and the search for insights. This means to avoid, from the outset, the by now almost classical dilemma in data value creation – spending 80% of the resources on pre-processes, and only 20% on results. Consequently, data collection and preparation should be designed with a focus on simplicity and accessibility. The results should then ideally be visualized in a flexible tool by the project team, which is supported in building the proficiency to use it. Following this approach ensures that buzzwords such as 'self-service' or 'enablement' actually translate into sustainable results.

Given these objectives the choice for ECFR’s European time series was for a simple yet effective combination of only two tools: a text table for each of the 42 KPI and Tableau for all further steps of data preparation, normalization and visualization. The name of each individual data sheet and only three of the contained columns – year, value, country – provide all the information needed in the subsequent steps.
Further calculations, such as building groups of countries – e.g. the Baltics or the Benelux countries – or pre-structuring the values for certain visualization types, take place in automated steps with the help of Tableau Prep Builder. The advantage: all individual steps can be directly tracked, visually documented and adjusted when necessary. Any logical hiccups or incorrect inputs can be corrected immediately. Valuable time is not wasted by laboriously searching for errors in nested formulas and across several spreadsheets.
The specific example of ECFR’s data study on European cooperation demonstrates which factors generally apply to data value creation: start simple, expand step by step and enable the analysts involved to master the process and its tools themselves – not the other way around.
Thanks to its simple structure, the approach easily scales. Should the study be extended with additional years of raw inputs only the data preparation scheme will need to run again. The new results will then flow into the already polished visualization. At the same time, the data is not locked in to be used in Tableau. The preparation steps can be changed at any time and optimized for other tools. Instead of paying for the creation of rigid spreadsheets, the approach invests resources in a flexible workflow.
The specific example of ECFR’s data study on European cooperation demonstrates which factors generally apply to data value creation: start simple, expand step by step and enable the analysts involved to master the process and its tools themselves – not the other way around. In successful data value creation projects employing the appropriate tools only creates the basis for the intended outcome of any analysis: better decisions thanks to better information.
The ECFR study will be published in late autumn 2020 as part of ECFR’s Rethink: Europe project. It will be hosted on Tableau Public.
Further information is available here: www.ecfr.eu/eucohesionmonitor.
You can find a complete overview of all customer stories here
Do you have questions about one of our customer projects or basically about data visualization? Then you are welcome to contact us at any time.
We look forward to the exchange with you!
Your M2 Team
+49 30 2089870 10
info@m2dot.com · M2@Facebook · M2@Twitter · M2@LinkedIn · M2@Instagram