

- Technology
- Data Science & AI
AI as Cognitive Infrastructure
AI needs systems, not just smart chatbots
Read more

Our client acts as a biomedical research institution for the federal government and is largely responsible for public health care. The project carried out with M2 focuses on the comprehensive visualization of performance indicators that are crucial for a fast, precise and data-driven response of internal and external stakeholders in health surveillance.
AI needs systems, not just smart chatbots
Read more
Warum wir KI bei M2 neu denken – und was Dr. Faruch Amini dabei verstärkt
Read more![[Translate to English:]](/fileadmin/_processed_/6/5/csm_reInvent-2025_166c993970.png "[Translate to English:]")
What AWS re:Invent has shown is this: data and AI work is facing a fundamental transformation.
Read more
Security, Sovereignty, and the Responsibility of Organizations
Read more
How government digitalization is visibly improved through cloud solutions
Read more
From Generative AI to Cloud Sovereignty: Our Impressions From AWS Summit 2025
Read more![[Translate to English:]](/fileadmin/_processed_/1/c/csm_AdobeStock_1806332089_93bbb57dd1.jpeg "[Translate to English:]")
![[Translate to English:]](/fileadmin/_processed_/9/f/csm_neu_949f77846e.jpg "[Translate to English:]")
![[Translate to English:]](/fileadmin/_processed_/6/0/csm_Exasol_Logos_e6678e4c9f.jpg "[Translate to English:]")
Two days full of innovation and hands-on insights
Read more
Agentic Analytics & other highlights
Read more
![[Translate to English:]](/fileadmin/_processed_/0/0/csm_Newsletter_Blogartikel_ac491e77ea.png "[Translate to English:]")
The Berlin Senate Chancellery's D:ASH project
Read more![[Translate to English:]](/fileadmin/_processed_/6/7/csm_Vendor-Lock-In_f32d70f42f.png "[Translate to English:]")
![[Translate to English:]](/fileadmin/_processed_/a/9/csm_Lift-and-Shift_befc1ac711.png "[Translate to English:]")
How to make your cloud migration future-proof
Read more
Progress for data-driven innovation
Read more
When and how to use Multi-Fact Relationships in Tableau
Read more
With the help of AI, authorities and public sector institutions can evaluate documents and visualize complex data faster and more efficiently.
Read more
Advantages and migration options with M2
Read more
M2 offers companies customized solutions for sustainable ESG reporting
Read more
Artificial intelligence: Tableau Pulse redefines the future of data interaction
Read more
Review of our event at Hallesches Haus in Berlin-Kreuzberg
Read more
How to migrate your data from different systems to Tableau Cloud
Read more
Alteryx tips from our expert Alexander Gross
Read more
Alteryx tips from our expert Alexander Gross
Read more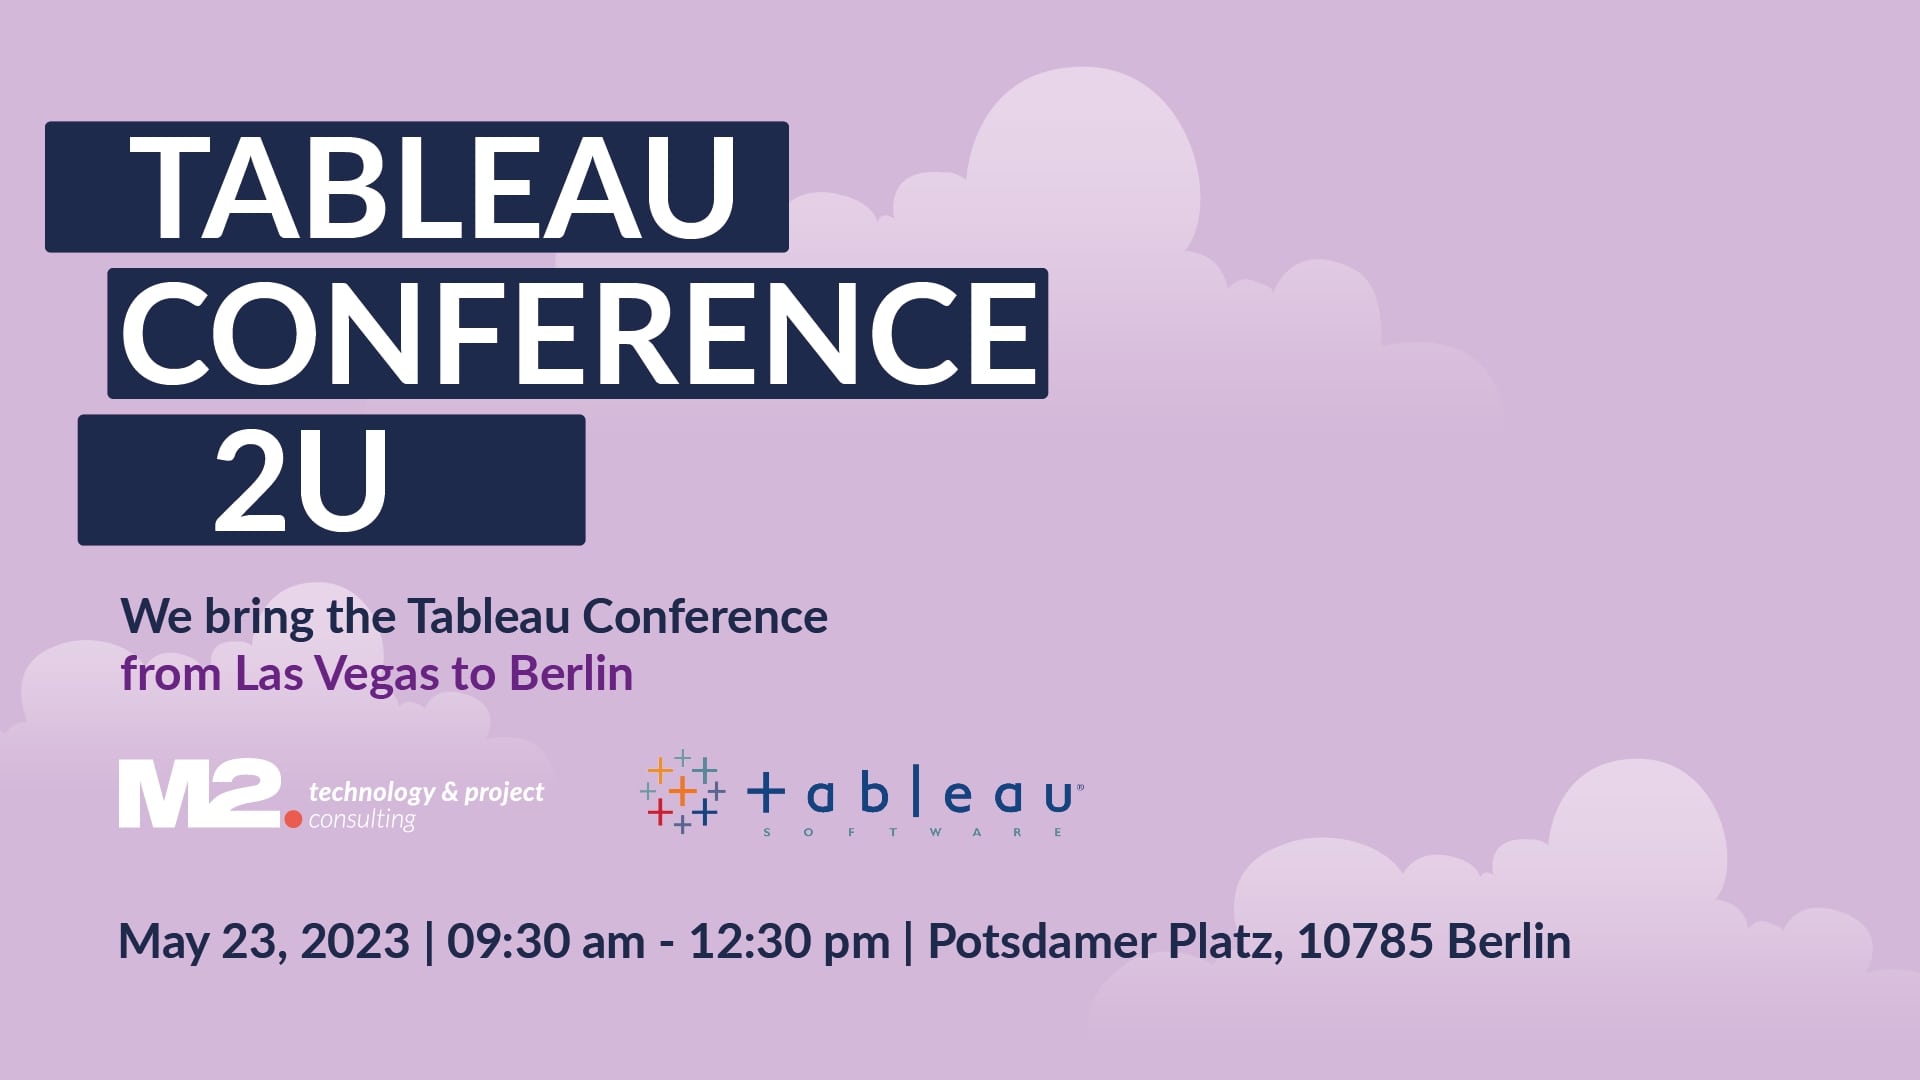
Joint event with Tableau at Potsdamer Platz
Read more
How to create better dashboards using prototyping in Figma
Read more
Alteryx tips from our expert Alexander Gross
Read more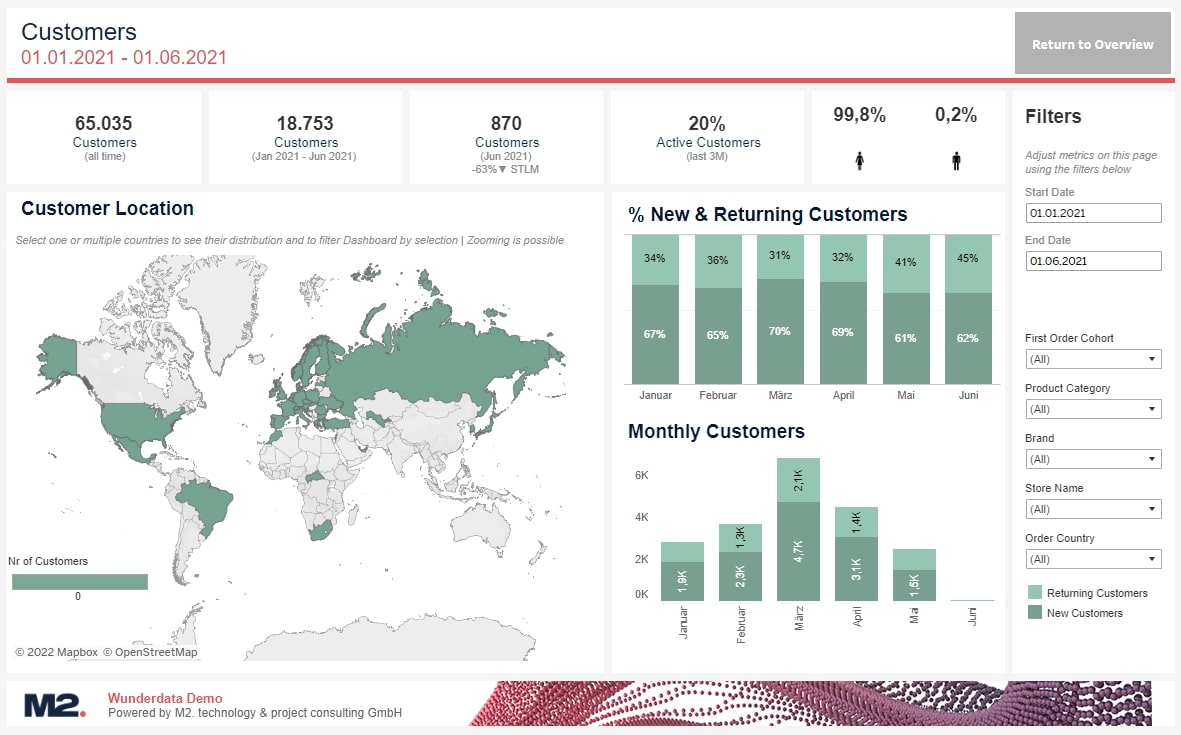
Use the power of Tableau and Exasol for your online store analysis
Read more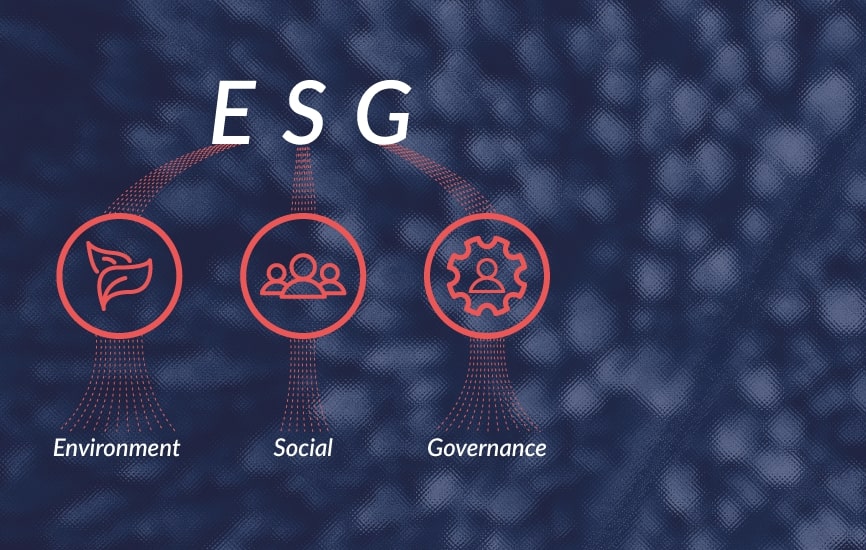
Part 2 of 2: KPIs & Roles
Read more
Part 1 of 2: Introduction & Reporting
Read more
M2 Breakfast | Alter.Next | Customer Stories | Managed Services | OTC
Read more
Alteryx tips from our expert Alexander Gross
Read more
Alteryx tips from our expert Alexander Gross
Read more
How operationalization & scaling of data infrastructure works
Read more
Alteryx tips from our expert Alexander Gross
Read more
Data-driven decision making in healthcare
Read more
Tableau Test Drive | Data Science Training | Mail Tool | M2 Team in new look
Read more
Alteryx Classroom Training | Tableau like a Pro | Nosta Group | eCommerce Connector
Read more
Connect your online store with Tableau
Read more
Alteryx tips from our expert Alexander Gross
Read more
Tableau in action at NOSTA Group
Read more
13 years M2 | Alteryx Inspire | Exasol & Labor Berlin | Video shoot | Zipcon
Read more

Labor Berlin optimizes its reporting with Exasol and Tableau
Read more
M2 Events & News | Courses | Webinars | Tableau | Alteryx | AWS
Read more
M2 Events & News | Courses | Webinars | Tableau | Alteryx | AWS
Read more
Alteryx tips from our expert Alexander Gross
Read more
We will show you how to optimize your daily work with Alteryx!
Read more
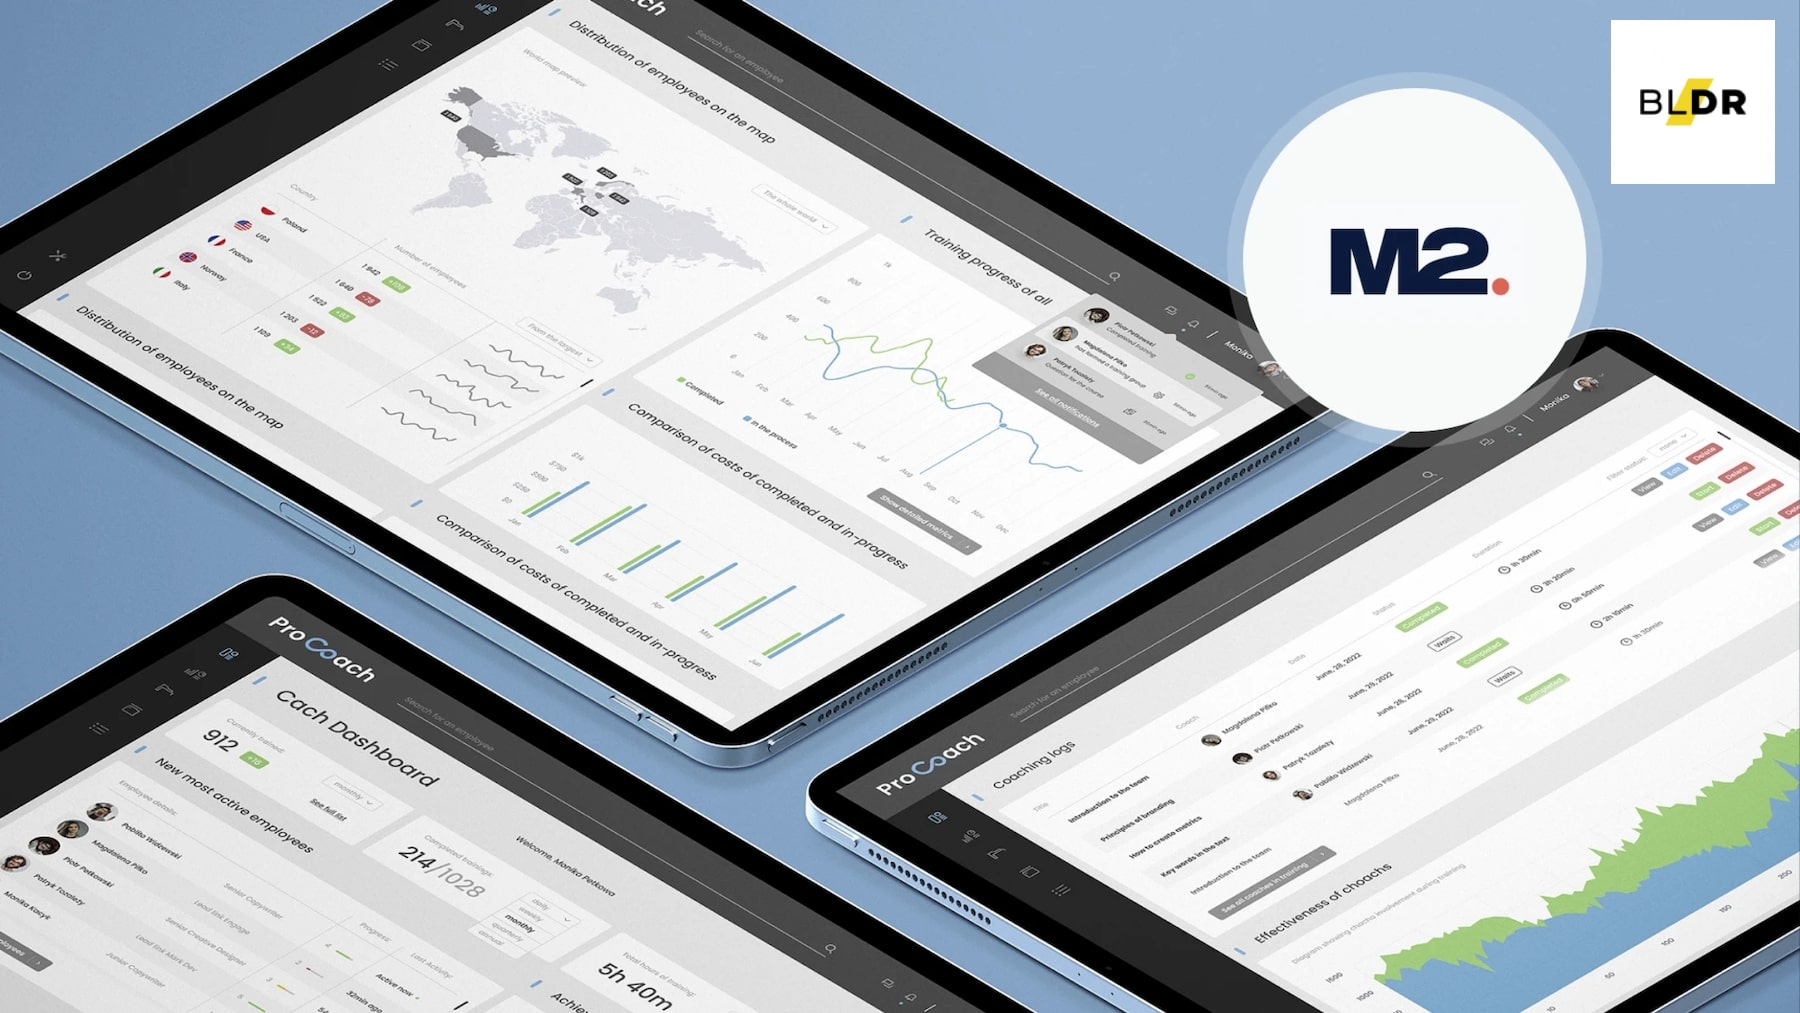
A cooperation project between Boldare and M2
Read more
Data Viadotto and M2 present their development
Read more
Alteryx tips from our expert Alexander Gross
Read more
Custom Geocoding, its use cases and our solution
Read more
Joint webinar event by Data Viadotto and M2
Read more
We help you to exploit the data potential of your company
Read more
Alteryx tips from our expert Alexander Gross
Read more
Alteryx tips from our expert Alexander Gross
Read moreSign up for our two-part webinar series
Read more
Snowflake Event on March 24 at the Turbinenhalle Moabit
Read more
Customer Story: How Tableau is used at Axel Springer to analyze advertising revenues
Read more
Alteryx tips from our expert Alexander Gross
Read more
Tableau will show you the key data trends that will shape 2022
Read more
Alteryx tips from our expert Alexander Gross
Read more
Alteryx tips from our expert Alexander Gross
Read more
Alteryx tips from our expert Alexander Gross
Read more