
The new Multi-Fact Relationship Data Model feature in Tableau 2024.2 simplifies the analysis of complex data sets, reduces data redundancy and enables faster, more accurate insights. We show how the function can be used.
In today’s data-driven world, businesses are constantly seeking ways to make faster, better-informed decisions. However, as the complexity of datasets grows, so do the challenges of effectively analyzing and visualizing them.
For instance, one common business problem might be understanding the impact of marketing campaigns on sales performance. Imagine a company running multiple marketing campaigns across different channels (e.g., social media, search engines, email), and they want to analyze how ad spend and campaign engagement (like clicks and impressions) translate to actual sales. Traditionally, analyzing this required combining complex datasets with joins or data blending, often leading to slower dashboards and potential inaccuracies.
With the introduction of Multi-Fact Relationship Data Models in Tableau Server 2024.2 and Tableau Cloud, this problem becomes much easier to solve. This game-changing feature makes it possible to analyze multiple datasets without the need for complex joins or blending, which eventually leads to faster and more accurate insights.
Why Multi-Fact Relationship Data Models?
In a traditional Tableau data model, a single fact table is typically connected to various dimension tables. Continuing our example, imagine the data source where a sales fact table is linked to dimension tables such as Product, Customer, and Date. However, if you want to analyze how marketing efforts—captured in a separate marketing fact table—affect sales, things can become complicated. This previously required manual blending or complex joins, which often resulted in duplicated data and slower performance.
With Multi-Fact Relationship Data Models, Tableau offers a more flexible and powerful approach. Now, both the sales fact table and the marketing fact table can be directly connected to shared dimensions such as Product and Date. Tableau automatically manages these relationships, reducing data redundancy, improving performance, and streamlining dashboard creation.
Simplifying Complex Data Models: Tableau’s Solution to Shared Dimensions
As we delve deeper into our business problem of combining efficiently marketing and sales data, we encounter significant issues. Dimensions like Product and Date are duplicated across both sales and marketing fact tables (see below).
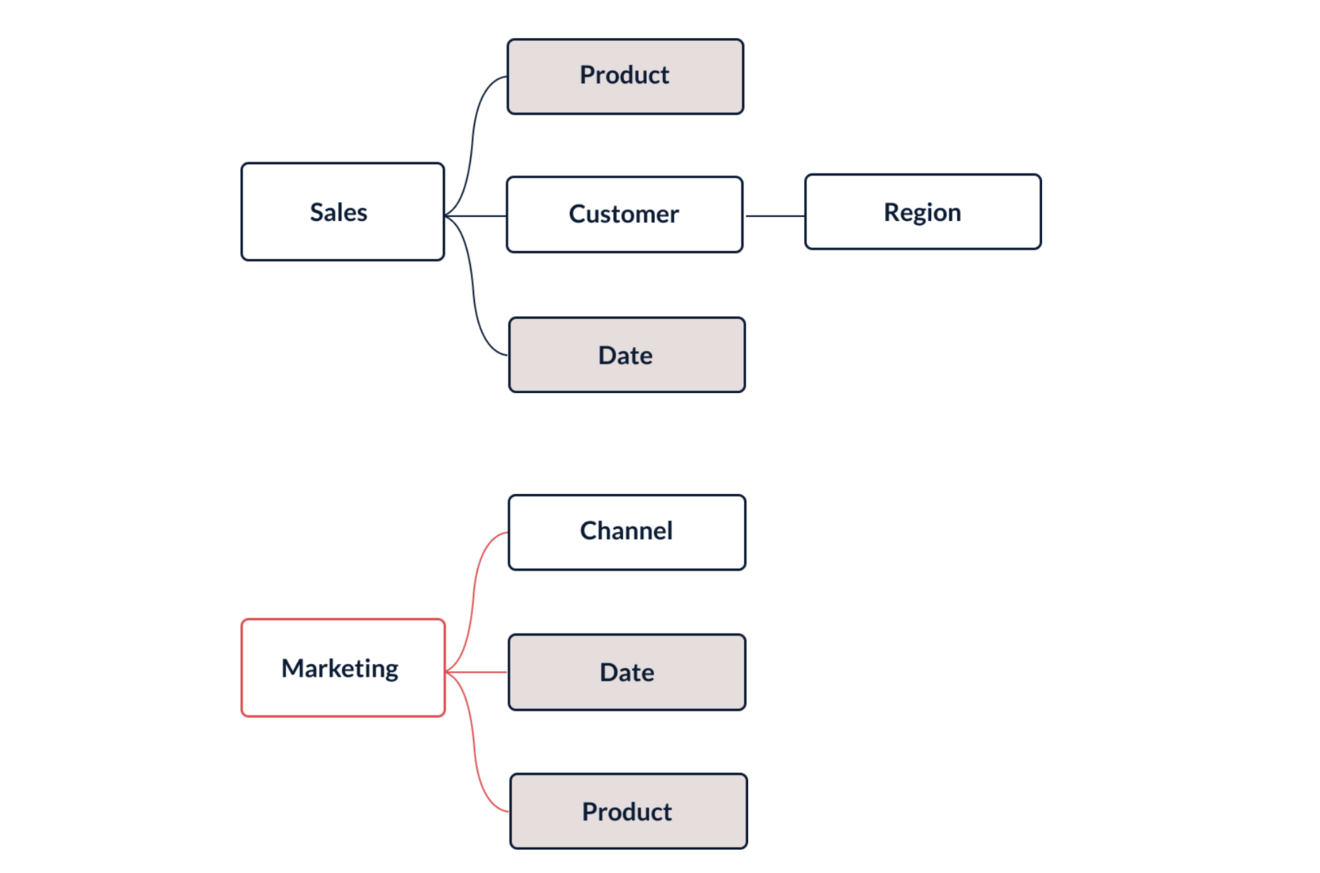
This scenario would be represented in Tableau as two separate data sources.

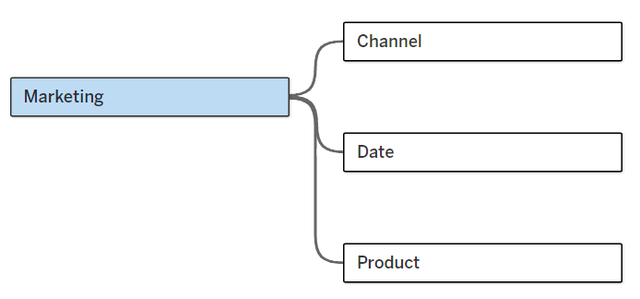
Now, with the new feature, users can easily connect both fact tables using shared dimensions such as Product and Date, streamlining the model and simplifying the process. (see below).
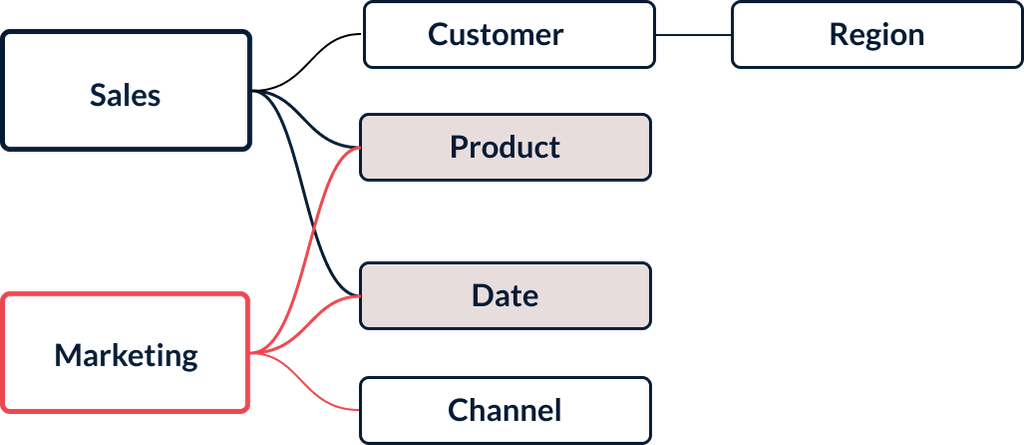
Resulting in one Tableau data source:
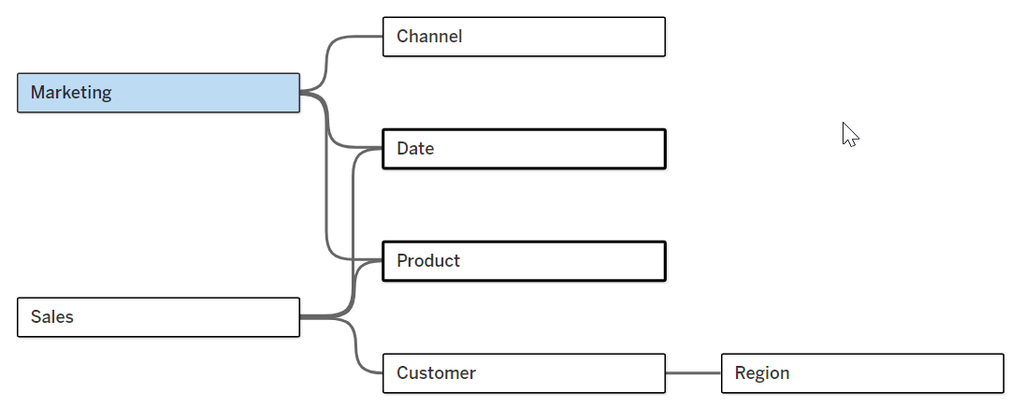
For instance, the marketing fact table tracks metrics such as impressions, clicks, and ad spend, while the sales fact table tracks metrics like units sold, revenue, and customer behavior. By linking both tables through shared dimensions like Date and Product the company can now analyze how a marketing campaign's engagement metrics translate into actual product sales.
This allows businesses to answer critical questions such as:
-
Which marketing campaigns generated the most sales conversions?
-
How does ad spend on different channels (e.g., social media, email) influence revenue for specific products?
-
Are there specific customer segments more likely to respond to marketing campaigns and make purchases?
Understanding Relatedness in Tableau Data Models
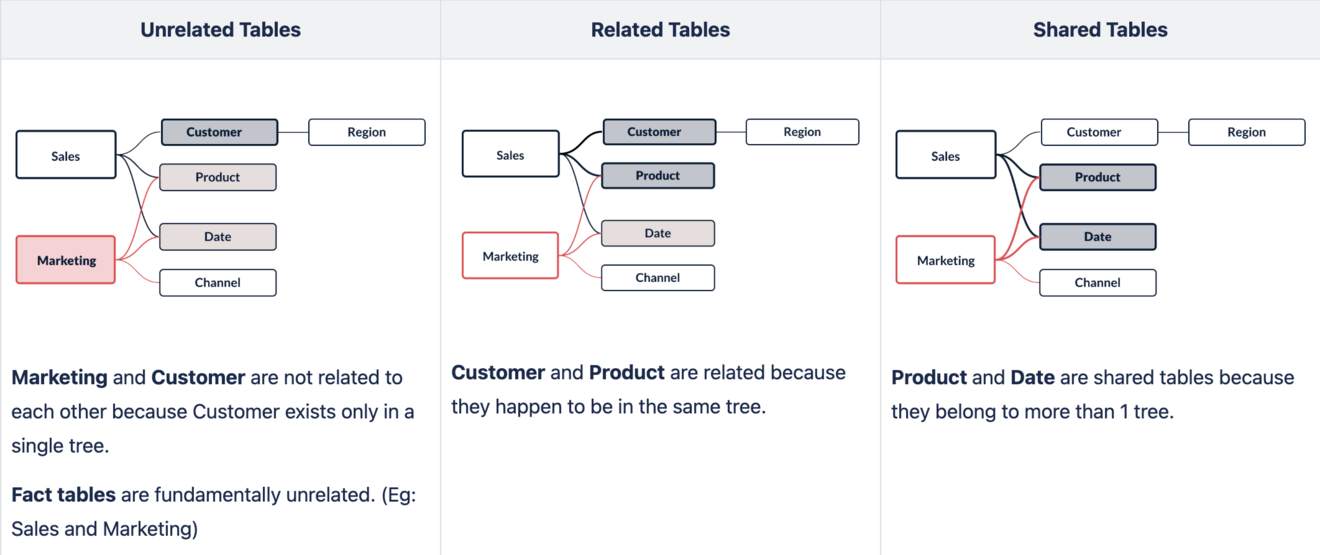
In Tableau's newer multi-fact relationship data models, relatedness refers to how tables are connected within the data model and influences how data is joined and analyzed in visualizations. This concept is particularly important in data models with multiple base tables, such as our business problem of sales and marketing. Before multi-fact models, data sources either had all tables related (within a single source) or unrelated when blending across different sources.
When tables are related, they are connected within the same tree structure, allowing Tableau to efficiently perform inner joins between dimensions and break down measures by those dimensions. Unrelated tables, on the other hand, exist in separate trees and are handled differently—dimensions from these tables are cross-joined, and measures are aggregated at the table level, leading to repeated values across different rows.
Some tables can also be shared between trees. Shared tables have multiple incoming relationships, meaning they belong to more than one tree, and any table downstream from them is also considered shared. During analysis, this often results in a more complex combination of data as Tableau works to stitch related data across multiple trees.
To conclude:
-
Related Fields: Dimensions are inner-joined, and measures are aggregated by those dimensions.
-
Unrelated Fields: Dimensions are cross-joined, and measures are aggregated within their table and repeated across rows.
-
Shared Fields (Stitched Fields): Tableau performs outer joins when fields share a common dimension, ensuring data is aggregated at the shared level.
Relatedness based on our multi-fact data model:
Current Limitations as of version 2024.2
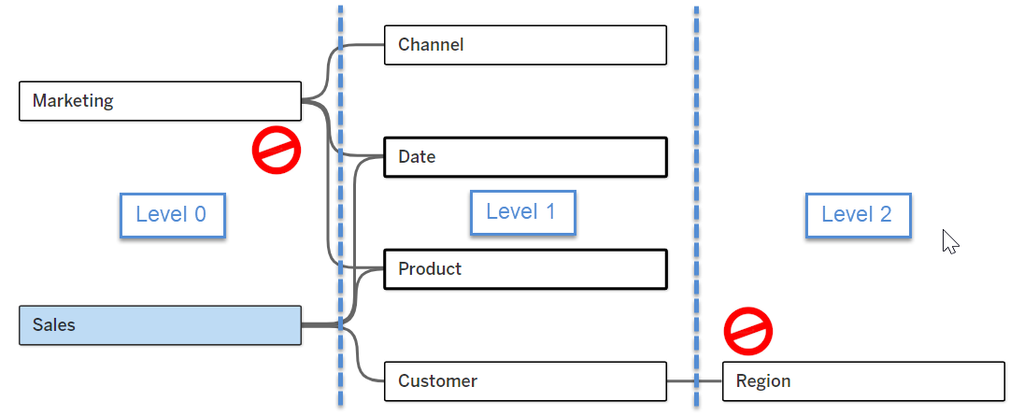
Currently a Fact table can only be linked to "first" level tables. Meaning in the following example, Fact table “Marketing” (Level 0) cannot be linked directly to dimension “Region” (Level 2).
Making Tableau Usage More Effective
The introduction of this new feature of Tableau significantly will cut down the time and effort spent on manual data preparation. For businesses analysis, this transformation brings several benefits:
-
Increased Flexibility: Users can now easily add or modify data sources and relationships without needing to restructure the entire data model. This flexibility allows businesses to adapt to evolving data needs and integrate new data points effortlessly.
-
Cost-Effective Insights: No need for excessive data preparation or costly infrastructure to handle duplicated dimensions or manual blends.
-
Easier Tableau Usage: Tableau automatically manages the relationships, reducing complexity for analysts, so they can focus on analyzing and preparing insights rather than managing very complex data relationships.
-
Model consolidation: With multi-fact relationships, Fact tables can now coexist within the same data source, sharing those common dimensions, meaning fewer individual data sources are required.
Maximizing the potential with M2
If your business is facing challenges in combining data for informed decision-making, contact us today to learn how Multi-Fact Relationship Data Models can enhance your analytics, improve performance, and drive better business outcomes.
