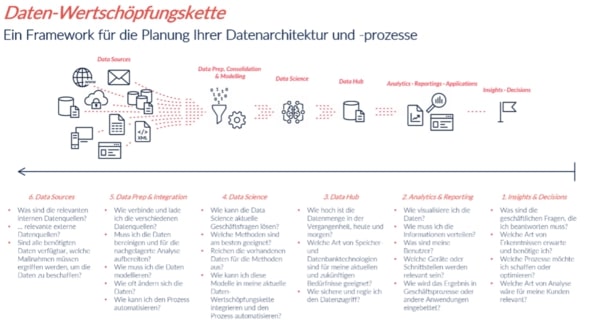
In a small series, we will describe the approach in our projects along our data value chain. The series of articles consists of three parts: "Data Purpose and Data Visualization," "Data Transformation and Data Analysis," and "Data Collection". zipcon consulting, one of the leading consulting firms in the print and media industry in the German-speaking world, asked us to outline the approach for a medium-sized print shop from the perspective of data experts.
In the first part of this series, we defined the data value chain and described the first steps on the way to data visualization and data analysis. As an example, we focused on a fictitious print shop with 100 employees. The second part of our series was about the next steps in the data value chain: Data Hub and Data Science.
The third and last part of the series is about preparing data and data sources for the final data analysis.
Data Prep & Integration
How do I connect and load different data sources?
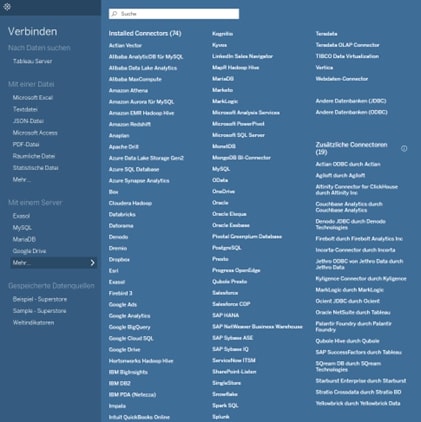
Nowadays, all BI tools offer a connection to the most common databases and can read files in different formats.
In our example, we need very specific data from the database: number of pieces, printed products, location and date. We can access this data with the MySQL query in the database. There are two ways to do this:
1. The data can be accessed directly in the database. Afterwards the data can be exported as csv.
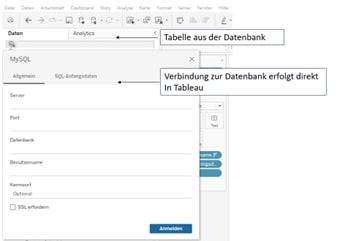
2. The access to the database is done through Tableau. The data is made available directly in Tableau
In practice, data from different data sources can be merged. For example, your data may exist in an Excel file on your computer and in a database to. Let's assume that in order to answer your existing questions, both data sources need to be connected.
Tableau Desktop offers you this possibility. In Tableau Desktop you can connect data from different data sources.
Note: if the data comes from different data sources, tables can have different formats and aggregation levels. The structure of data and data sources may differ significantly. To clean data and synchronize such existing differences so that the data is best prepared for data analysis, we use Tableau Prep, for example.
Tableau Prep is another tool in the Tableau portfolio.
This tool provides simple and convenient ways to merge data from different data sources and aggregation levels without any programming knowledge. As in Tableau Desktop, there is also an option in Tableau Prep to connect to data sources, regardless of whether they are stored locally on the computer or in a database.
How do I need to model the data?
Data can be modeled in different ways. A distinction is made between the following options:
- Flat data model: A two-dimensional matrix of data elements.
- Hierarchical model: Data is stored in a tree-like structure. Each entry has a parent entity or trunk.
- Network model: This model builds on the hierarchical model. It allows 1:n relationships; their assignment is done via a link table.
- Relational model: a collection of predicates over a finite set of predicate variables, for whose possible values or combinations of values constraints apply.
- Star schema model: normalized fact and dimension tables remove attributes with low cardinality for data aggregations.
- Data vault model: records with long-term stored historical data from various data sources arranged in hub, satellite, and link tables and related across them.
The decision to model data is influenced by various factors. We need to know which database we are using. And we should be clear about which visualization we want to create in the end.
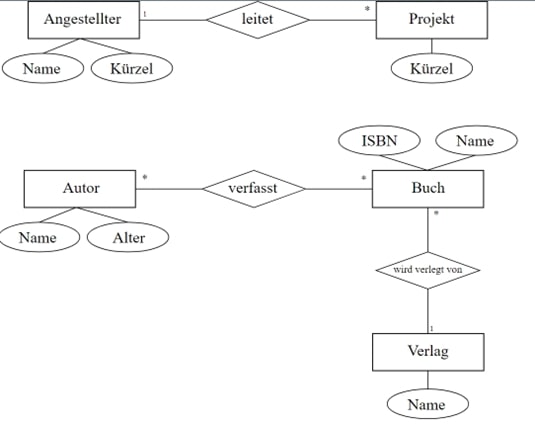
For our example, the relational model comes into question, because we use MySQL as the storage location for our data. In this model, the data is stored thematically. For example, authors and designers (author's name, addresses, categorization) are stored in one table. Publisher information is stored in another separate table. Other information can be created in additional tables. In this way, several tables are created according to a certain topic. Separating the information in different tables ensures that our queries in the database are performed quickly and with high performance. For this purpose, the tables should contain a column with a unique key. Mostly these are ID numbers. Using these key columns we can connect tables and build an individualized table.
The figure below shows such a schema. The schema defines what data is stored in the database and how this data is related to each other. The process of creating a schema is called data modeling.
Data sources
Now we have defined our question from the beginning of the process and know what data is needed. Our initial question was in which quantity print products like brochures, flyers or postcards were produced in Germany in the past five years (2016 - 2021).
To answer the questions, we need the following data: Print products, number of pieces, location and date.
If this information is available within the company, it must be clarified how access to the data can be made possible. Depending on the evaluation requirements, externally available, public data can of course also be added to internal company data. However, the data required in our example should come exclusively from the internal data source.
In a self-service environment with multiple publishers, it is not uncommon for a project to contain a variety of content in the database that is similarly named or based on the same or similar underlying data. In addition, content is often published without descriptive information. For example, a report might have different naming:
- 20221003 Report_v1
- 20221004 Report_v1
- 20221004 Report_v2
- 20221004 Report_final
The reason for different naming could be, for example, that minimal changes were made in each version. This complicates the work of analysts who may not have confidence in the data they are supposed to use for their analysis and visualization due to unclear file names or histories.
To help your users find the data that is reliable and recommended for their type of analysis, there should be a clear and standardized syntax and delivery process as part of the data preparation process.
Many organizations have developed their own code on how to designate the correct or relevant data sources. For example, a data source might have a certified seal or be named according to a traffic light scheme. Once this is ensured, the analysis and visualization of the data can begin using Tableau.
This was the last part of our blog article series on the data value chain. We hope we were able to give you an overview of our approach in a classic business intelligence project.
Do you have any questions about this article or about M2? Then please feel free to contact us at any time. We look forward to exchanging ideas with you.
Your M2 Team
Phone: +49 (0)30 20 89 87 010
info@m2dot.com


