
- Exasol
- AWS
- Webinar
- Training
- M2
- Alteryx
- Tableau
M2 NewsBlog: Oct 17 2022
Alteryx Classroom Training | Tableau like a Pro | Nosta Group | eCommerce Connector
Read more
To improve healthcare services, a state ministry required a scalable solution for data analysis and visualization. Using Amazon QuickSight, a modern BI platform was implemented. This enables health data to be efficiently processed, presented, and utilized in real time.
Alteryx Classroom Training | Tableau like a Pro | Nosta Group | eCommerce Connector
Read more
Connect your online store with Tableau
Read more
Alteryx tips from our expert Alexander Gross
Read more
Tableau in action at NOSTA Group
Read more
13 years M2 | Alteryx Inspire | Exasol & Labor Berlin | Video shoot | Zipcon
Read more

Labor Berlin optimizes its reporting with Exasol and Tableau
Read more
M2 Events & News | Courses | Webinars | Tableau | Alteryx | AWS
Read more
M2 Events & News | Courses | Webinars | Tableau | Alteryx | AWS
Read more
Alteryx tips from our expert Alexander Gross
Read more
We will show you how to optimize your daily work with Alteryx!
Read more
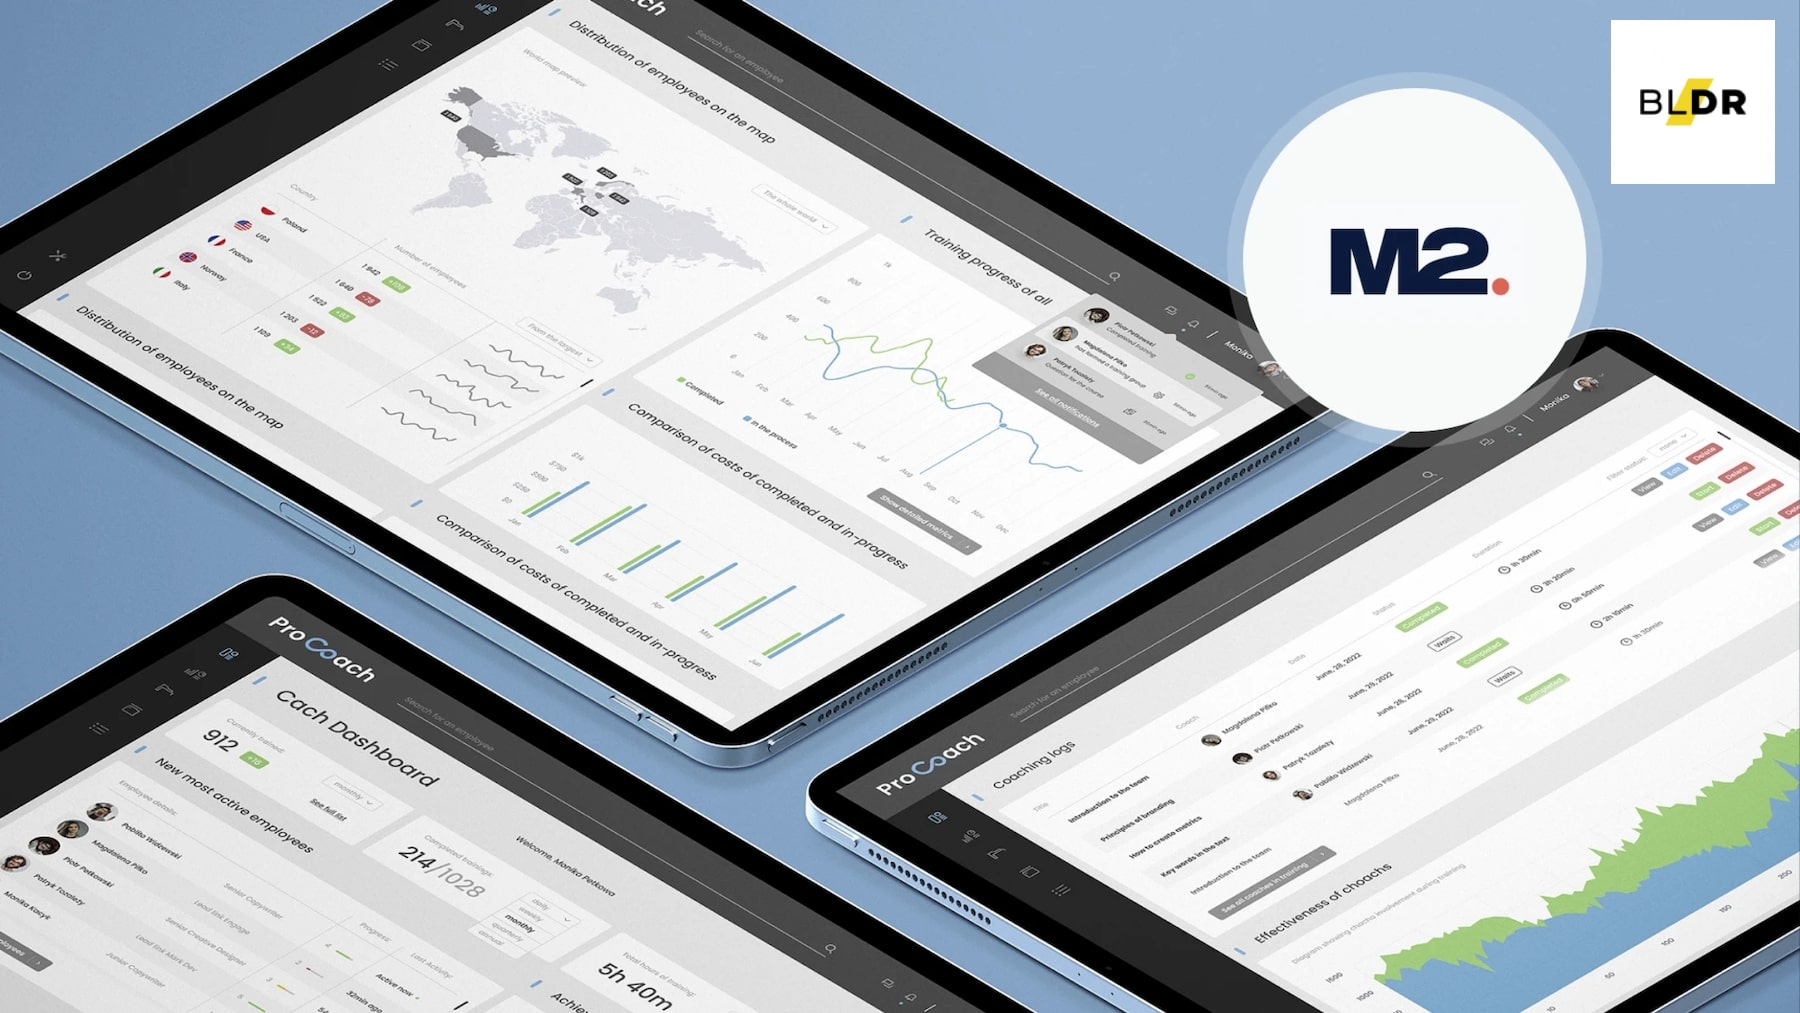
A cooperation project between Boldare and M2
Read more
Data Viadotto and M2 present their development
Read more
Alteryx tips from our expert Alexander Gross
Read more
Custom Geocoding, its use cases and our solution
Read more
Joint webinar event by Data Viadotto and M2
Read more