
- Data Analytics
- Data Science & AI
- Tableau
Business Intelligence 2026
The key study findings on growth, budgets, and AI maturity.
Read more
Public sector organizations are facing an uncomfortable balancing act. Data is expected to become more transparent, open data requirements keep rising, and departments need faster analysis — yet budgets, staff, and IT capacity remain tight. This is exactly the tension that determines whether business intelligence stays just another cost item or becomes a genuine step toward modernization.
That's why Amazon QuickSight is coming back into focus. Not because government agencies simply need another dashboard tool. The question has changed: how can data be made available in a way that's secure, cost-effective, and easy to understand?
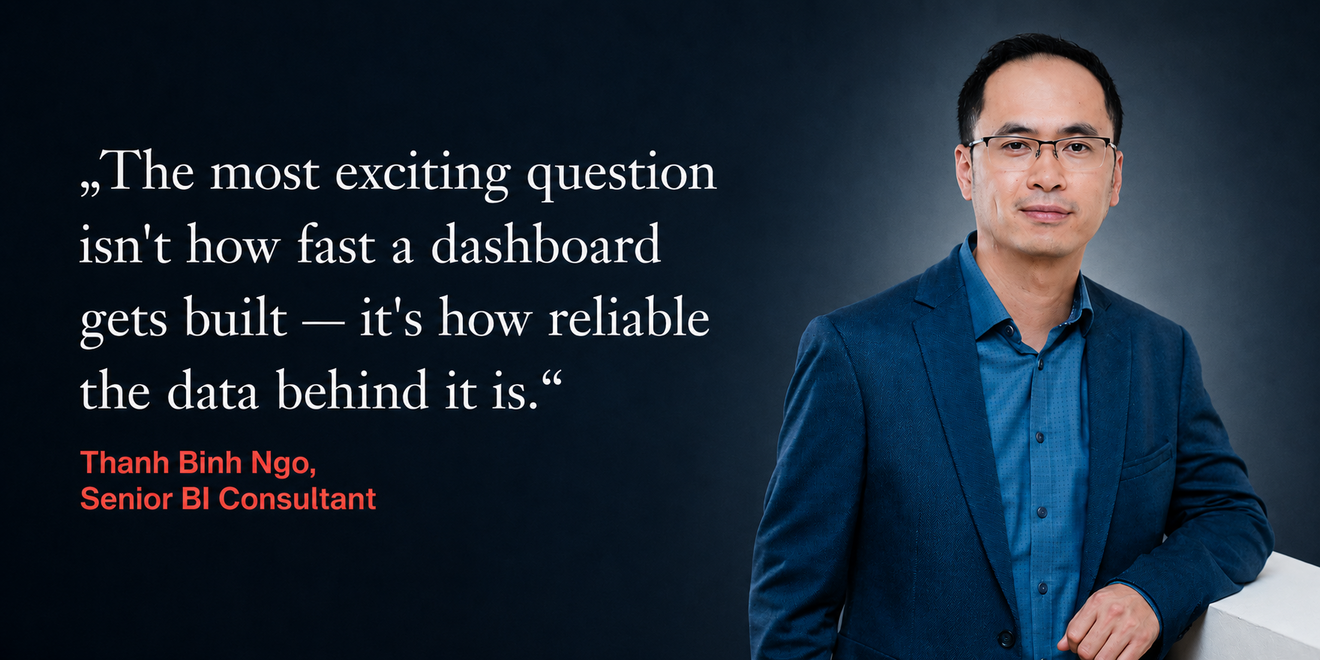
For Thanh Binh Ngo, Senior Consultant for Analytics, BI Modernization, and Data Platforms at M2, this is exactly where modern BI begins. To him, QuickSight isn't just the interface where charts eventually show up. The real value lies underneath: in the data foundation, the semantic model, the permissions logic, and in how departments can work more independently with information going forward.
This perspective is becoming even more relevant given current developments at AWS. The "Generate Analysis" feature in Amazon Q for QuickSight lets users create analyses from natural-language input. Users describe the analysis they need, select the relevant datasets, and receive a proposed analysis in return — including visualizations, structure, and calculated fields. Work that used to take hours of manual dashboard building can now be prepared significantly faster.
At first glance, this sounds like a simple product update. In practice, it's more than that. AWS is clearly steering QuickSight toward AI-powered analysis. This strategic shift changes what actually matters when rolling out and operating the platform. As dashboards get built faster, the quality of the underlying data becomes even more important. An AI feature can only propose meaningful analyses if terms are unambiguous, metrics are cleanly defined, data sources are reliable, and permissions are correctly enforced. Otherwise, you end up with speed but no reliability.
What does this mean for consulting? Generative BI doesn't automatically fix the problem of poorly structured data — it makes it more visible. If two departments interpret the same metric differently, if regional levels are maintained inconsistently, or if data is only pulled together manually, then even the best analysis feature will only get you so far. The decisive step is to think about Amazon QuickSight starting at the data model level.
This is also reflected in M2's work for the Ministry of Labor, Social Affairs, Health and Equality of the State of Saxony-Anhalt (Ministerium für Arbeit, Soziales, Gesundheit und Gleichstellung des Landes Sachsen-Anhalt). There, M2 built a modern analytics platform for health and care data on AWS and Amazon QuickSight. Data is now consolidated centrally, made comparable across regions, and made accessible through interactive dashboards. What used to be a legacy solution slated for replacement has become a scalable foundation for administration, departments, and public communication. More insights into the project are available in the Customer Story.
Projects like this show what QuickSight can deliver in the public sector when it's embedded the right way. The goal isn't to rebuild existing reports as-is, but to create a BI landscape that's maintainable long-term, takes work off departments' plates, and makes data accessible to different audiences.
A second current trend fits right in here: AWS has announced BI Migration Agents in AWS Transform, a feature designed to support the migration of existing Tableau and Power BI environments toward Amazon QuickSight. For many organizations, this is a good reason to start the conversation, since many BI environments have grown organically over the years. The result is often a large number of dashboards, inconsistent metric logic, high license costs, and little transparency about which content is actually still in use. How mature this migration feature is for production use remains to be seen in practice — but the market momentum behind it is real.
A move to QuickSight would never be a purely technical migration. It would be an opportunity to reassess your entire BI landscape. Which dashboards are business-critical? Which reports are redundant? Which data models need to be consolidated? What content can be migrated as-is, what should be rethought, and where does QuickSight create real added value?
For existing QuickSight customers, the question looks different. They don't need to start from scratch — many already have dashboards, data sources, and user groups in place. The next step is optimization. Are the datasets ready for AI-powered analysis? Are metrics defined in a way that departments actually trust them? Is there a clear roles and permissions model in place? Are dashboards actually being used? And is QuickSight already a self-service platform — or still just another reporting tool?
For organizations still working with Tableau, Power BI, Qlik, or older reporting solutions, the starting point looks different. Here, it's first and foremost about orientation. Is QuickSight worth adopting as the target platform? What costs could realistically be reduced? Which dashboards are migration-ready? Which data sources need to be prepared? And which pilot project is best suited to demonstrate value quickly?
This makes QuickSight a concrete modernization path. Existing customers can prepare their environment for self-service BI and AI-powered analysis. Organizations considering a switch can assess their BI estate in a structured way and evaluate QuickSight as a target platform. And government agencies can address open data and transparency requirements more pragmatically, without having to rebuild every reporting initiative from scratch.
On June 24, 2026, Dietrich Bartsch and Thanh Binh Ngo from M2 discussed exactly these questions live with Behörden Spiegel, moderated by Frederik Steinhage. Three points in particular stood out in the conversations that followed:
Experience shows that these same three topics come up in almost every conversation with government agencies, regardless of department or organization size. That's why we've put together both the recording and a summary.
Missed the webinar, or want to revisit a specific point? Our landing page has both: the full recording and the key takeaways from the follow-up discussions, summarized concisely. Feel free to take a look — we'd be glad if it answers one of your open questions.

The key study findings on growth, budgets, and AI maturity.
Read more
How government agencies are putting data to use faster, more clearly, and more cost-effectively.
Read more

When and how to use Multi-Fact Relationships in Tableau
Read more
M2 offers companies customized solutions for sustainable ESG reporting
Read more
Review of our event at Hallesches Haus in Berlin-Kreuzberg
Read more
Part 2 of 2: KPIs & Roles
Read more
Part 1 of 2: Introduction & Reporting
Read more