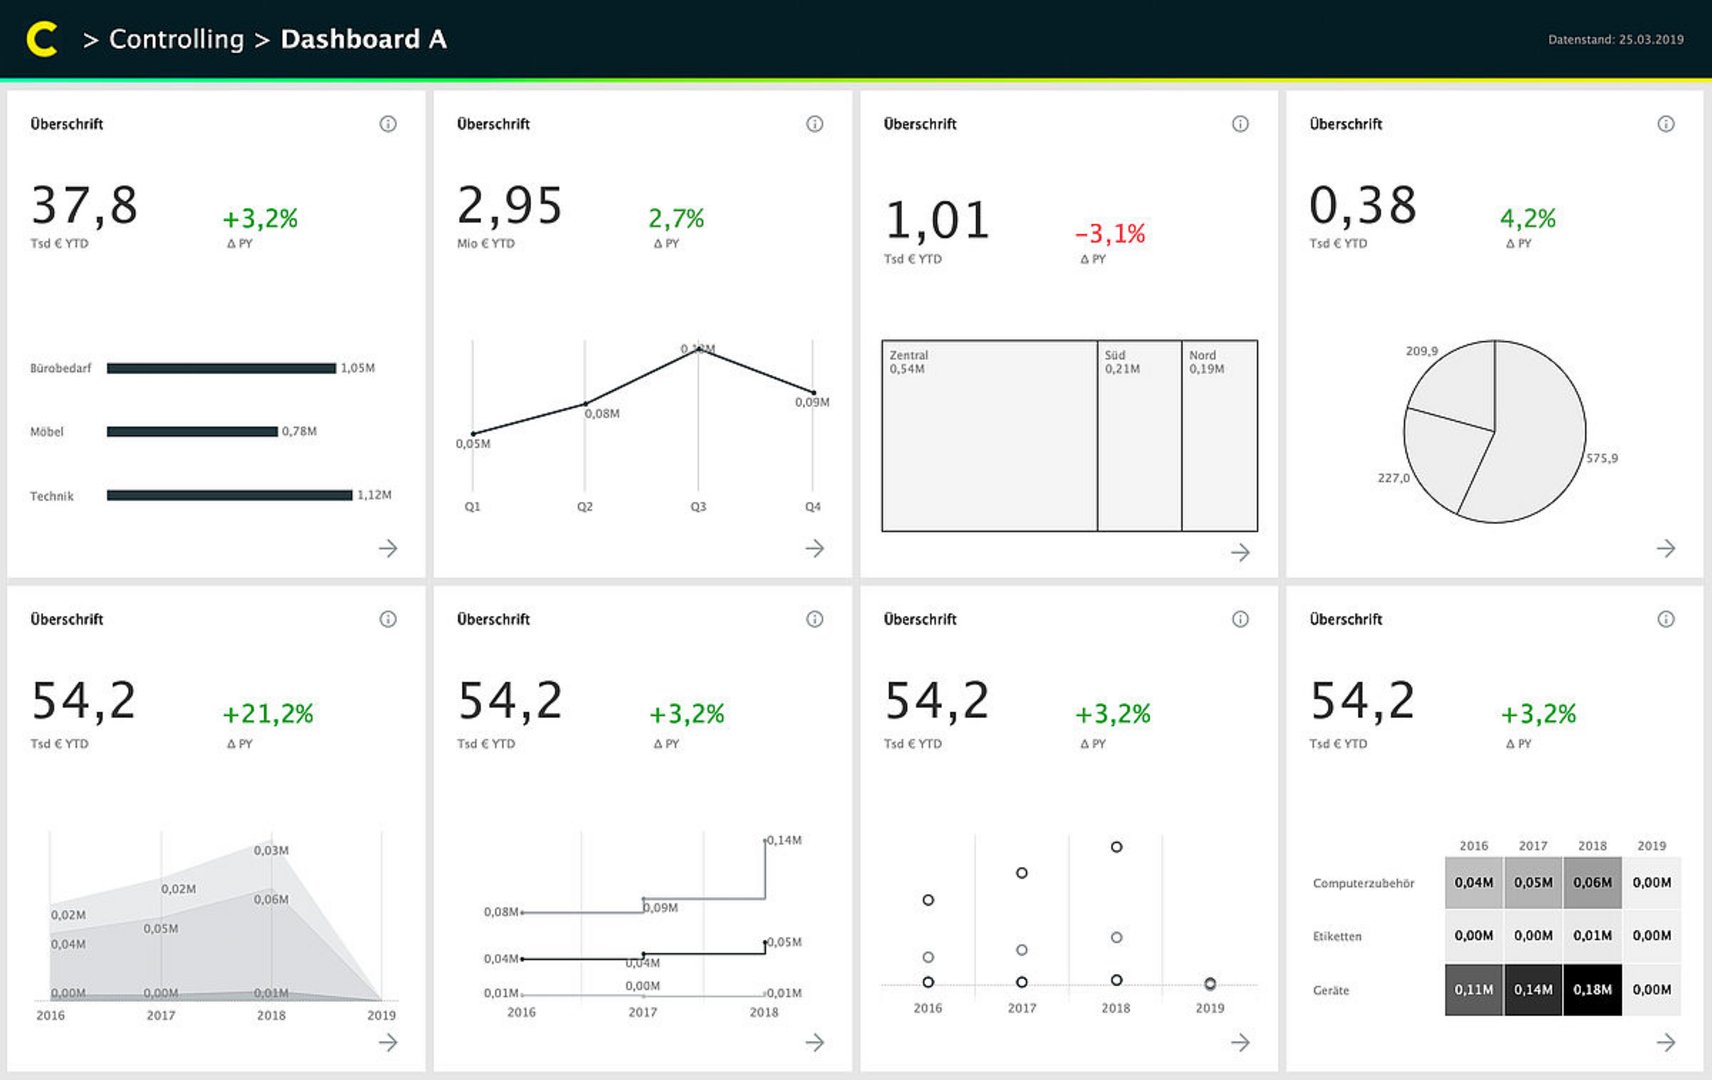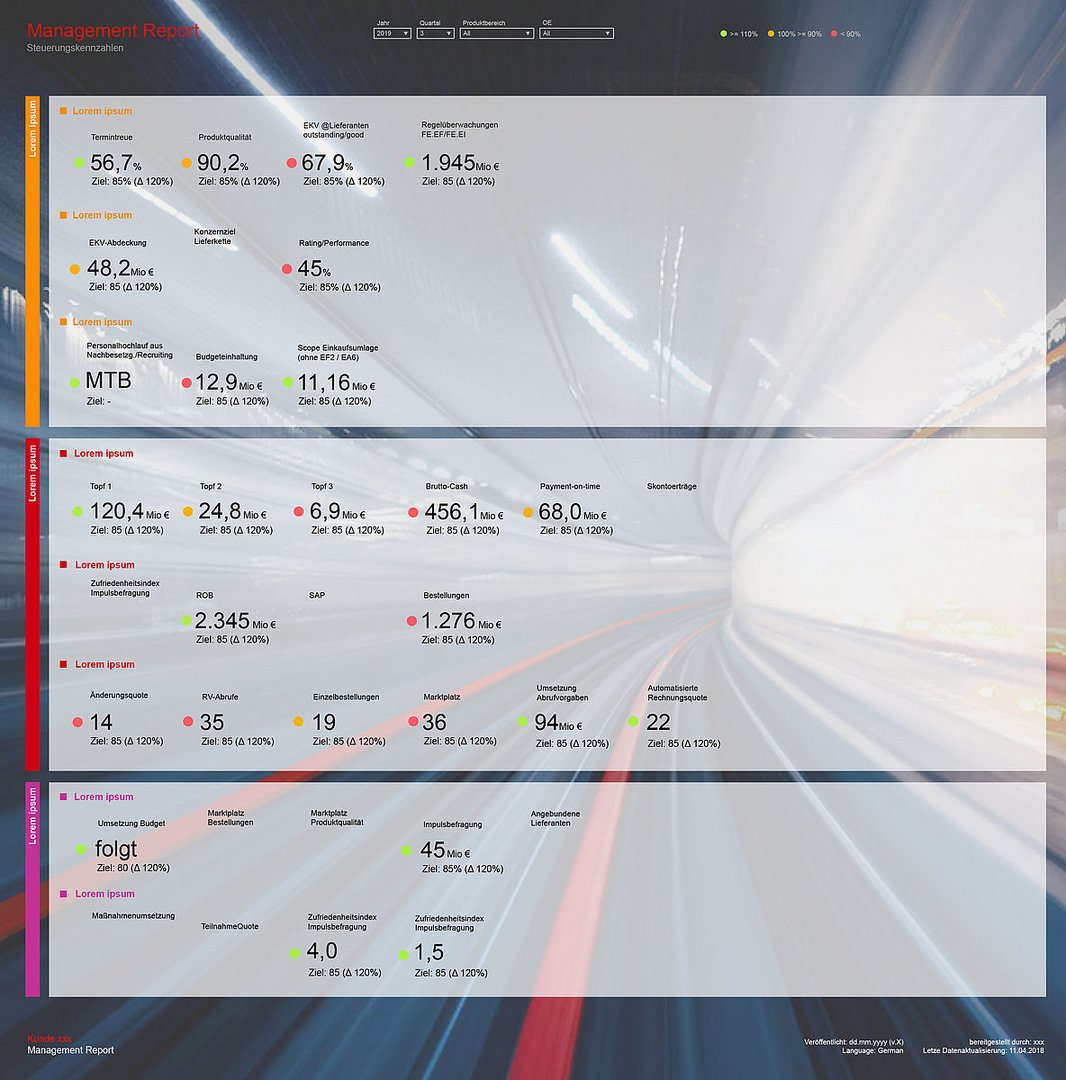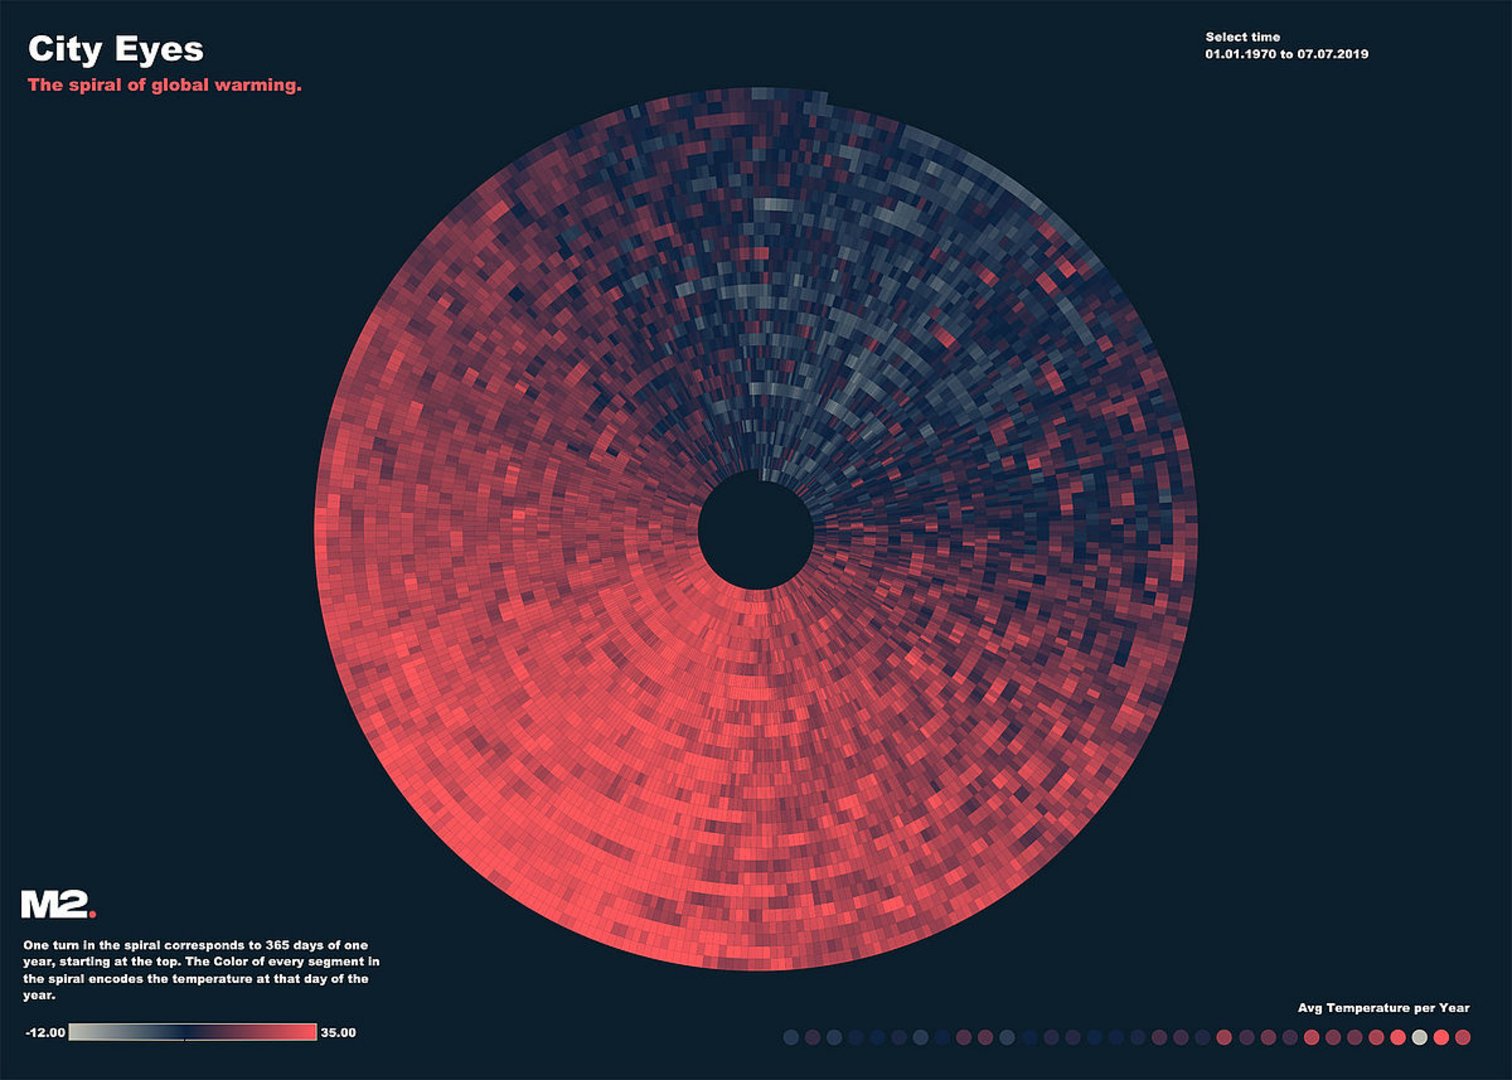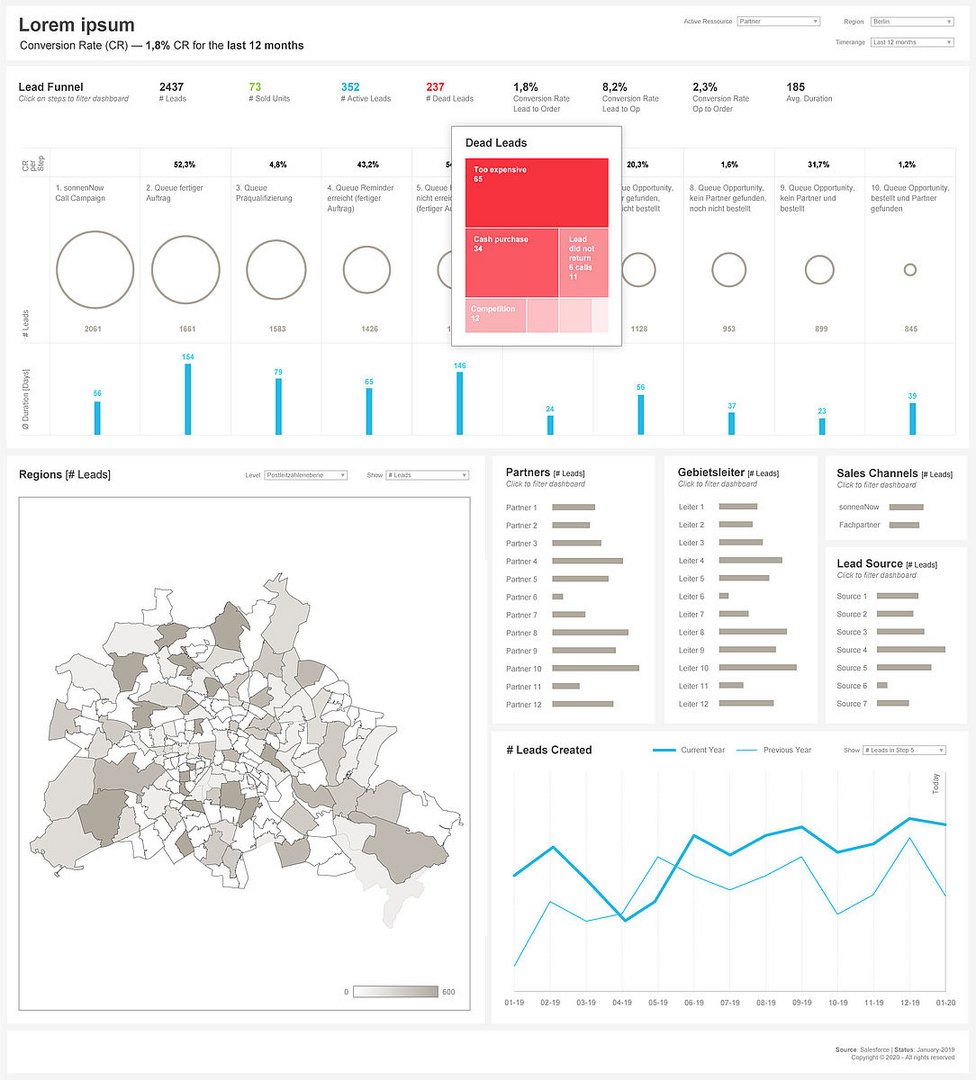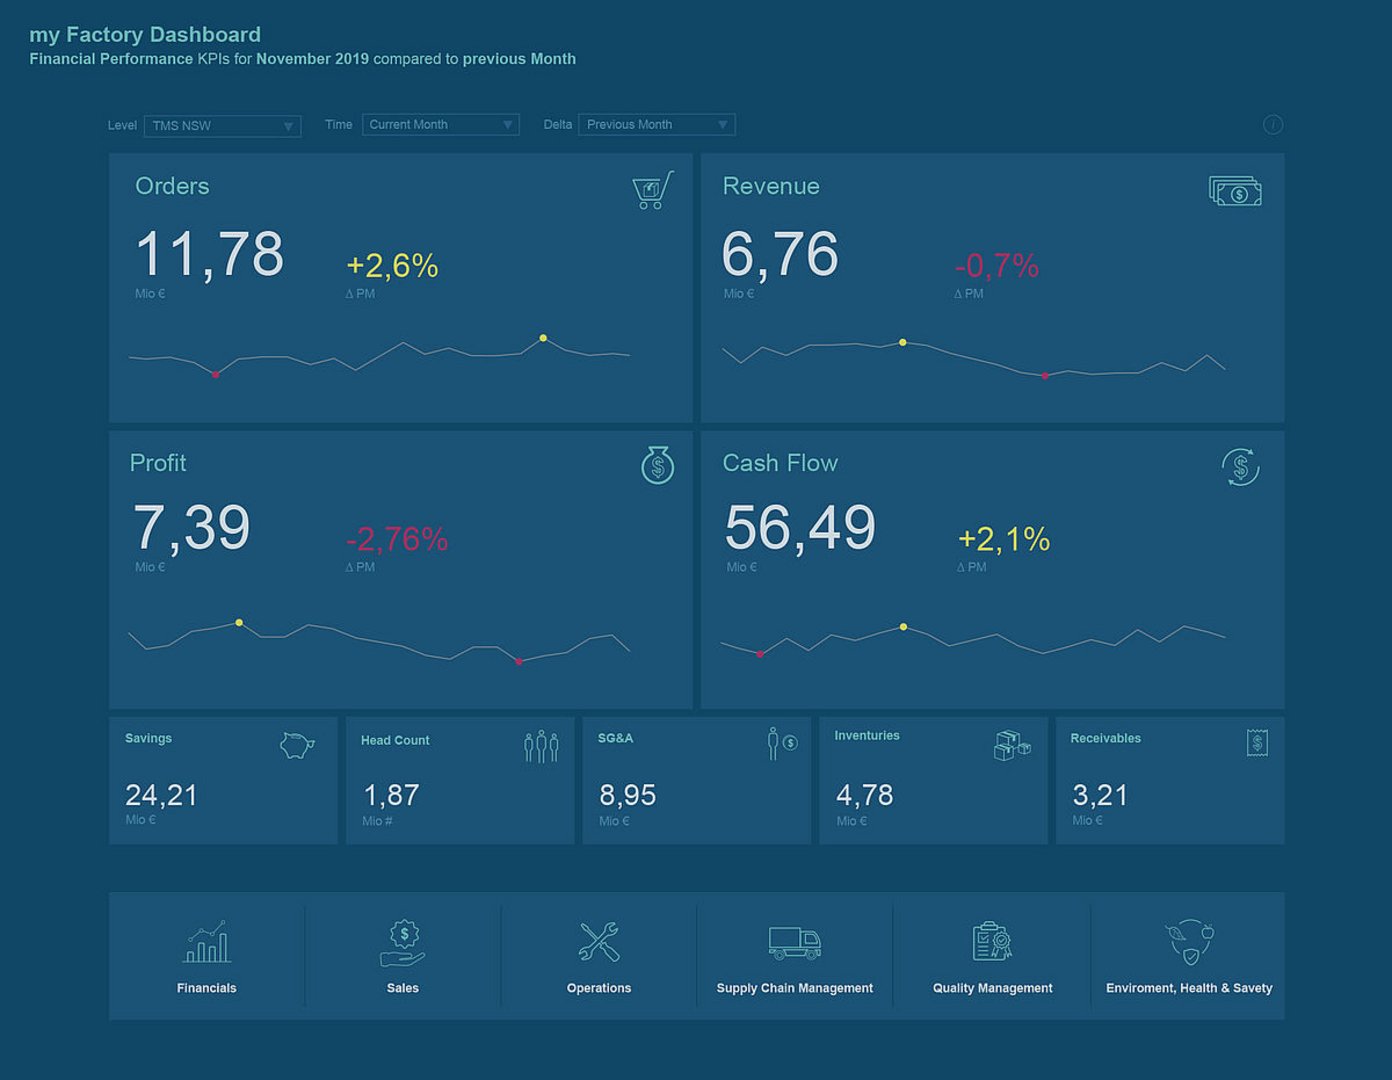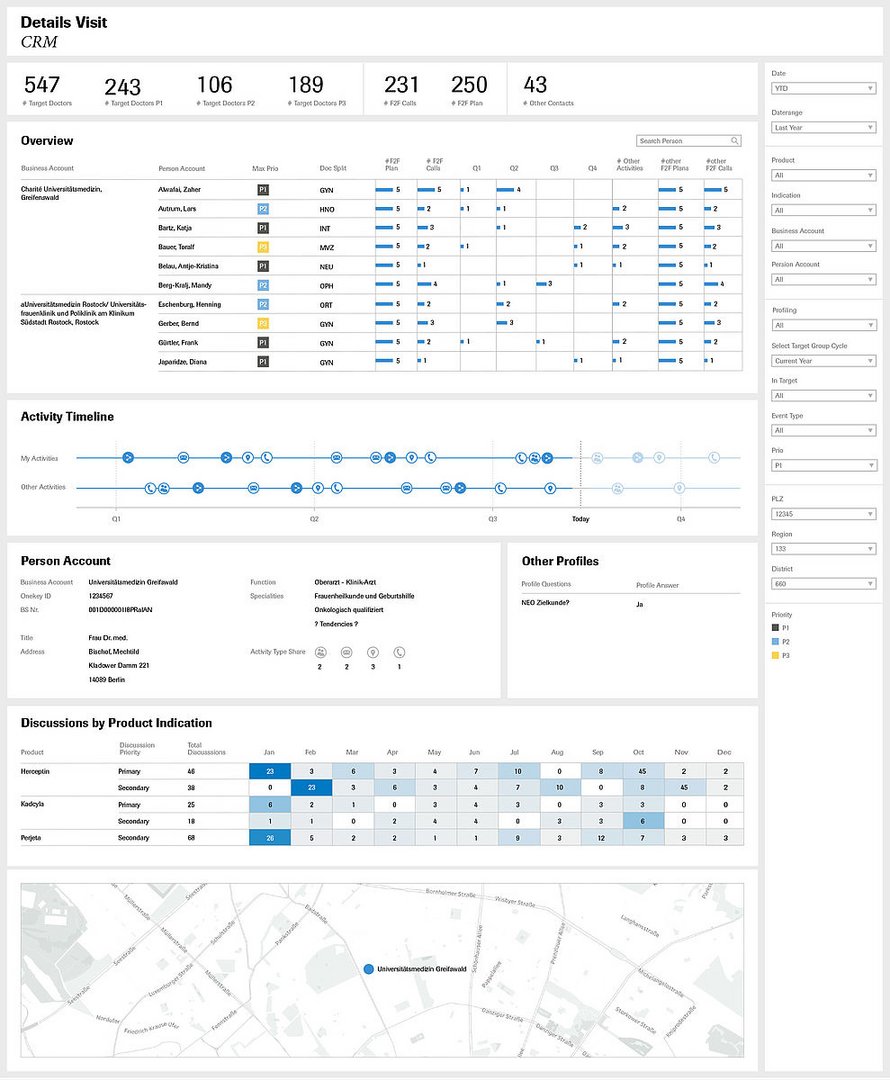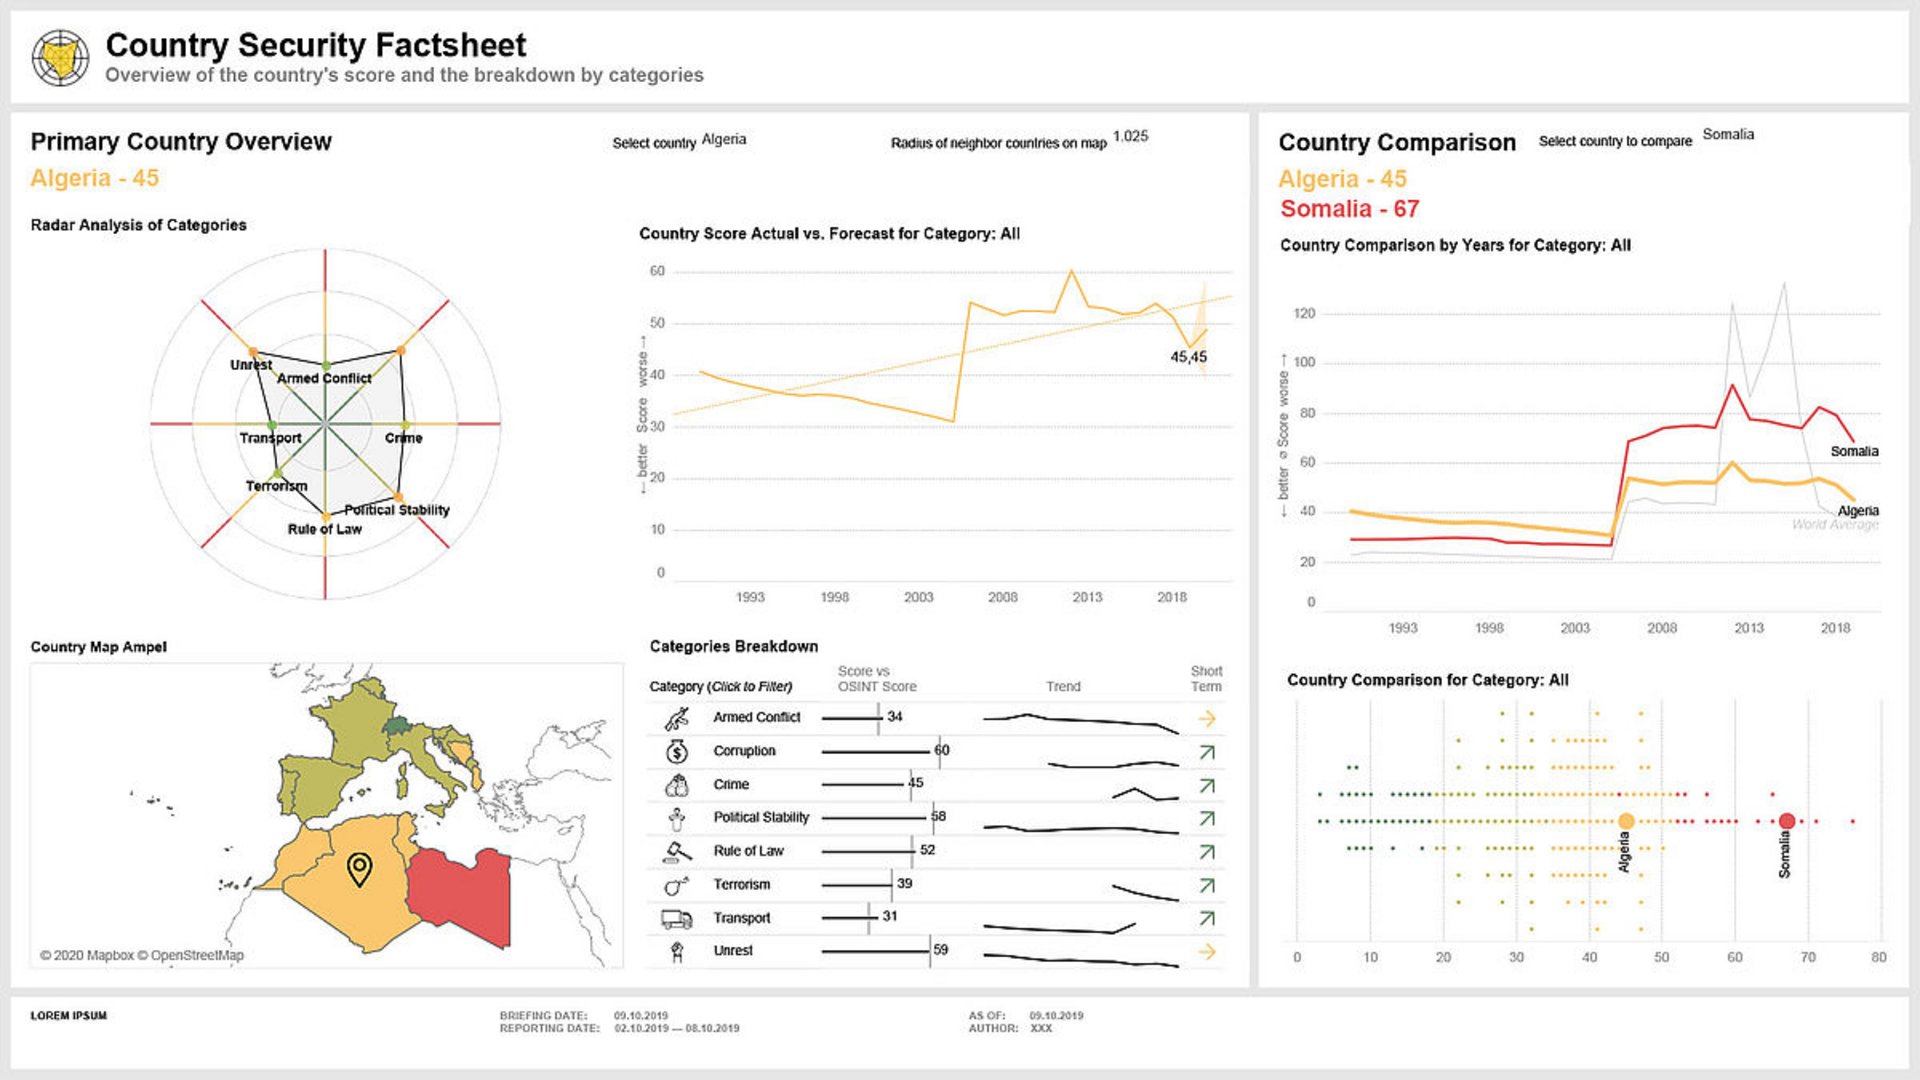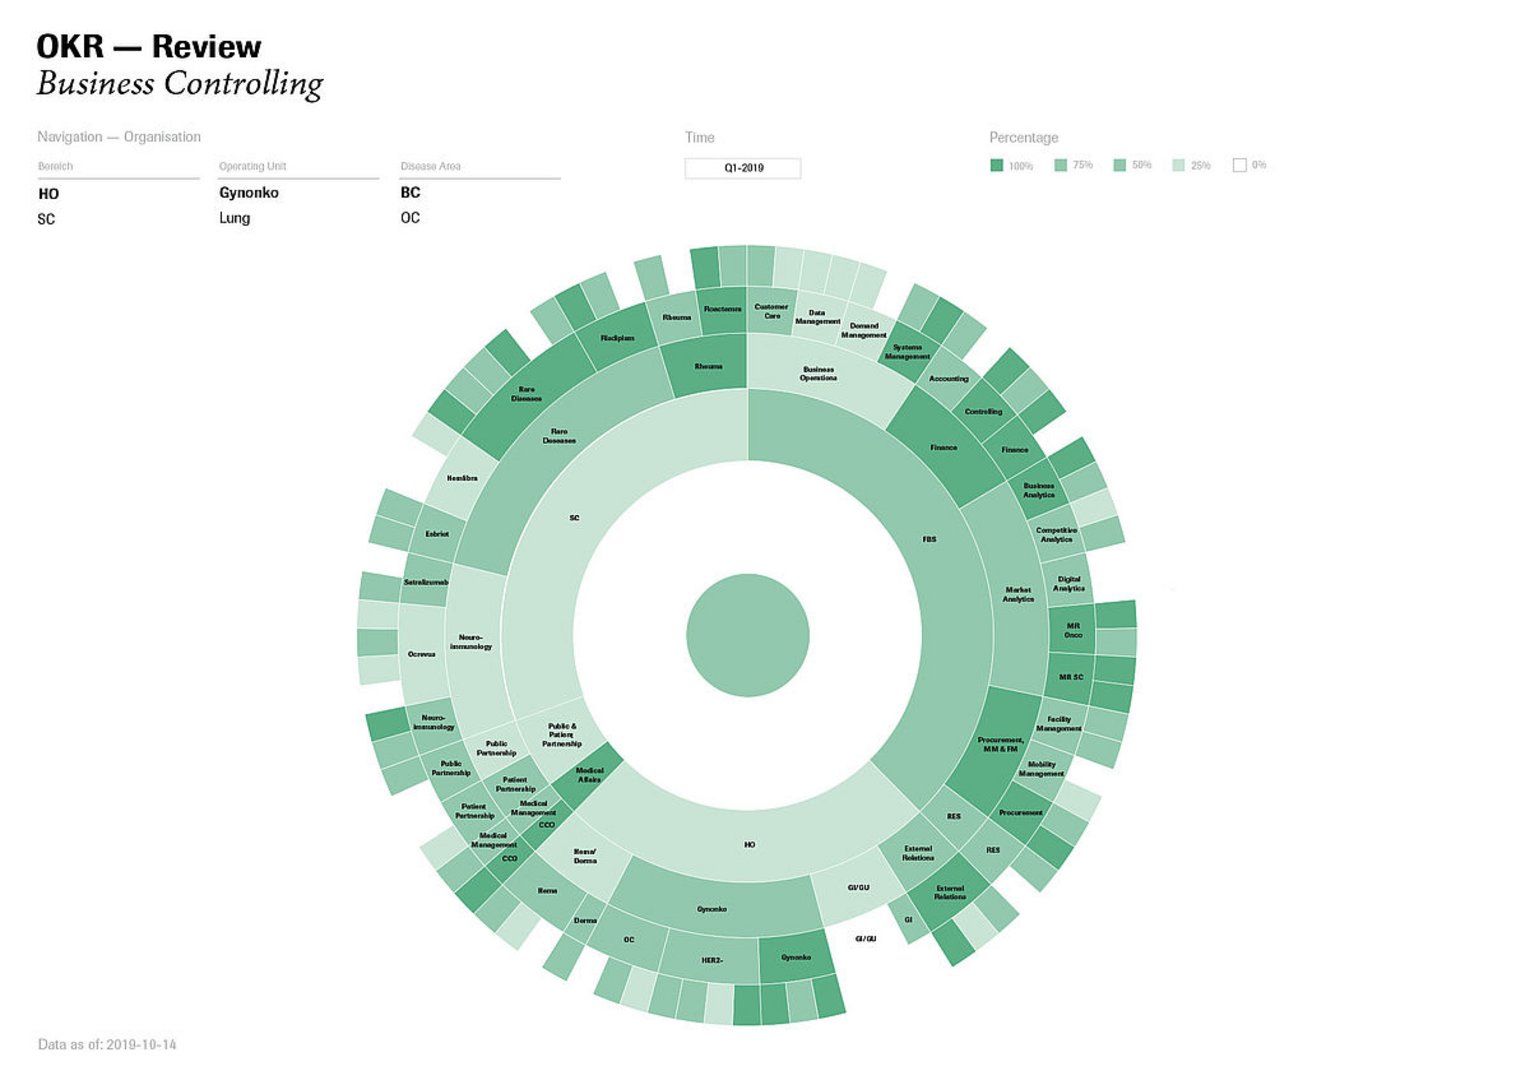
Data visualization & dashboard design
Professional dashboard design enables companies to present complex data in a visually appealing way. This allows users to quickly access important information and make informed decisions to increase operational efficiency.
Analyzing survey data with Tableau
Data value creation does not have to be complicated. Support for a project by the European Council on Foreign Relations (ECFR) and the Mercator Foundation shows how added value and valuable time can be gained when implementing data-based studies, even without a large infrastructure or complex processes.
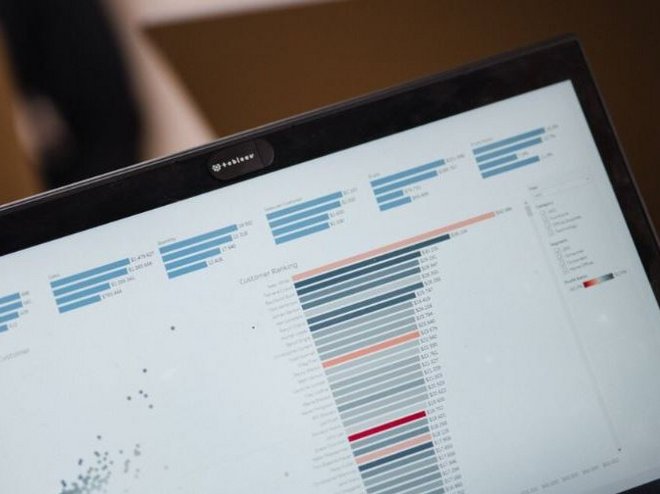
Partner Solution: Tableau Software
Tableau's powerful data visualization and business intelligence solutions help you unlock the full potential of your data. With an intuitive, easy-to-use interface and a wide range of data connectors, you can easily create interactive, insightful visualizations without the need for extensive programming or technical knowledge.
Data Visualization Trainings
In our Data Visualization trainings & workshops, participants gain the basic knowledge about data visualization, dashboard design and accessible dashboards:
- M2 Data Visualization Training
- M2 Dashboard Design Workshop
- M2 Accessibility Training
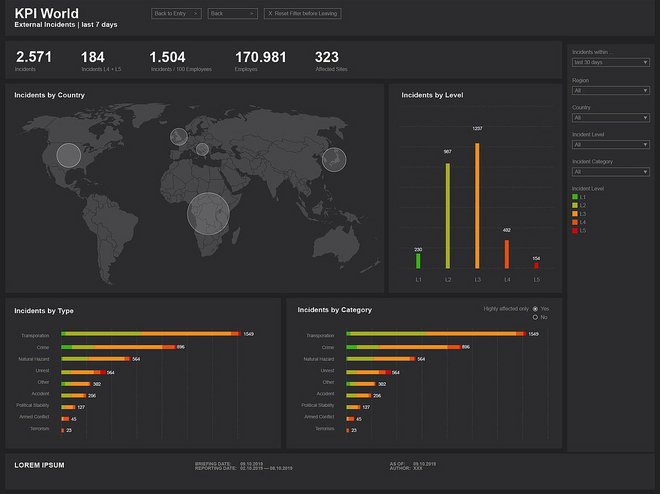
Whitepaper: Dashboard Design
A white paper on the optimized design of interactive dashboards
In our consulting practice, we work with dashboards every day and optimize them for our clients. Like any visualization, a dashboard can be well designed and intuitive to experience - or the opposite.
In our free white paper, you can find out what makes a well-designed dashboard, what you need to look out for and what steps you need to take when creating one.
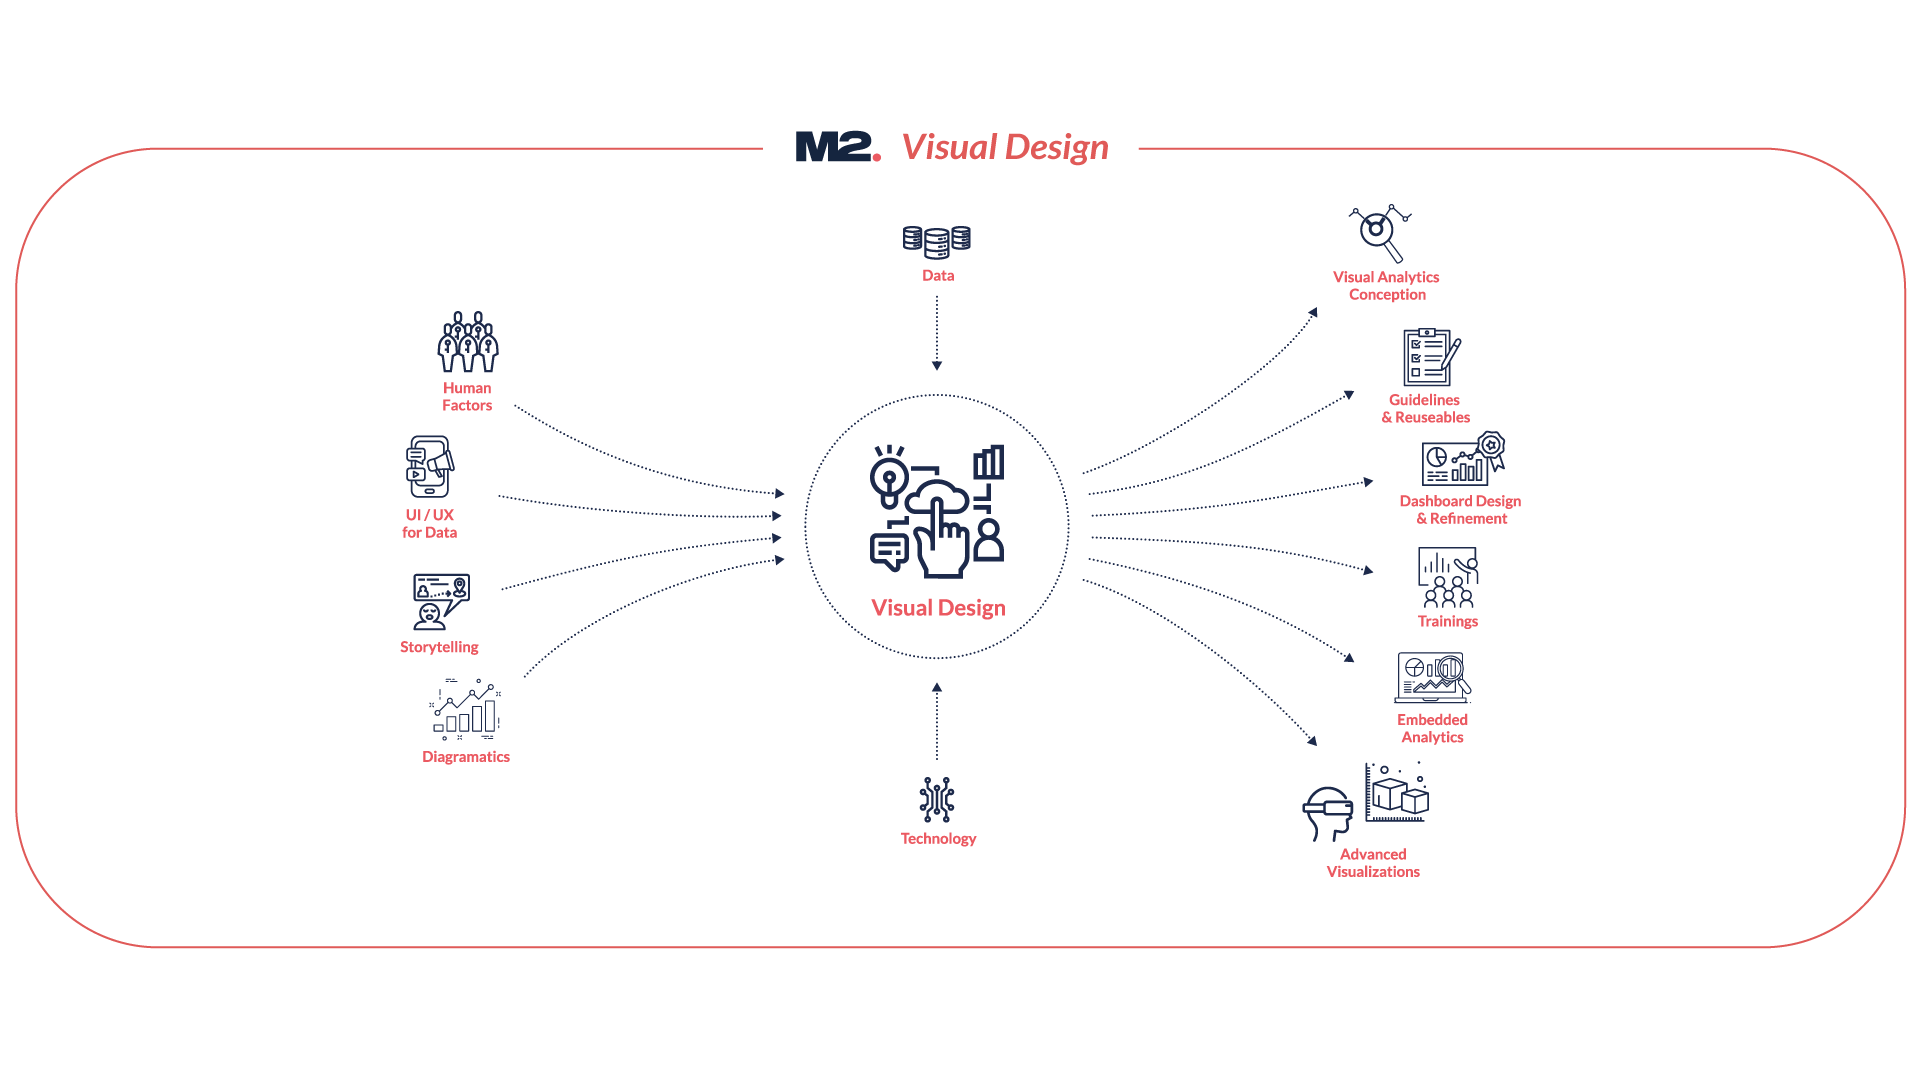
In Data Visualization, we attach great importance to design aspects and clearly defined stages in the creation process, which we always follow step by step in the cooperation with our clients to achieve an optimal Dashboard Design in the end.
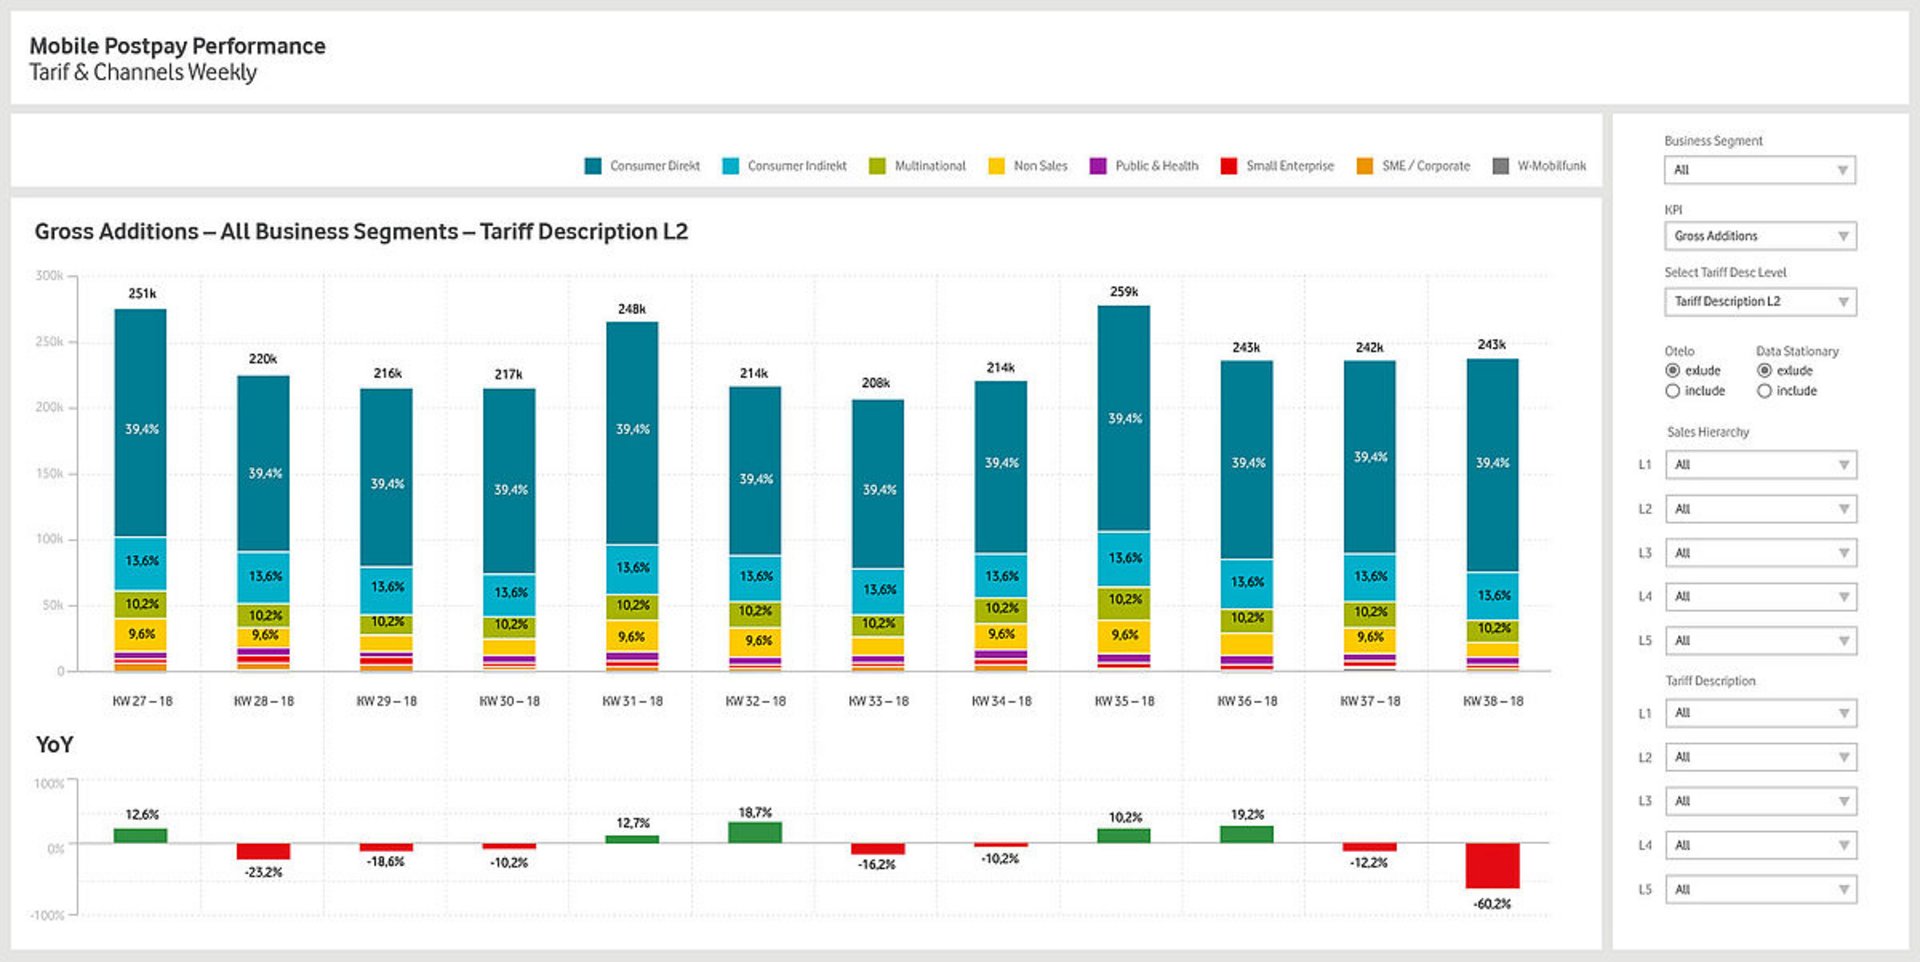
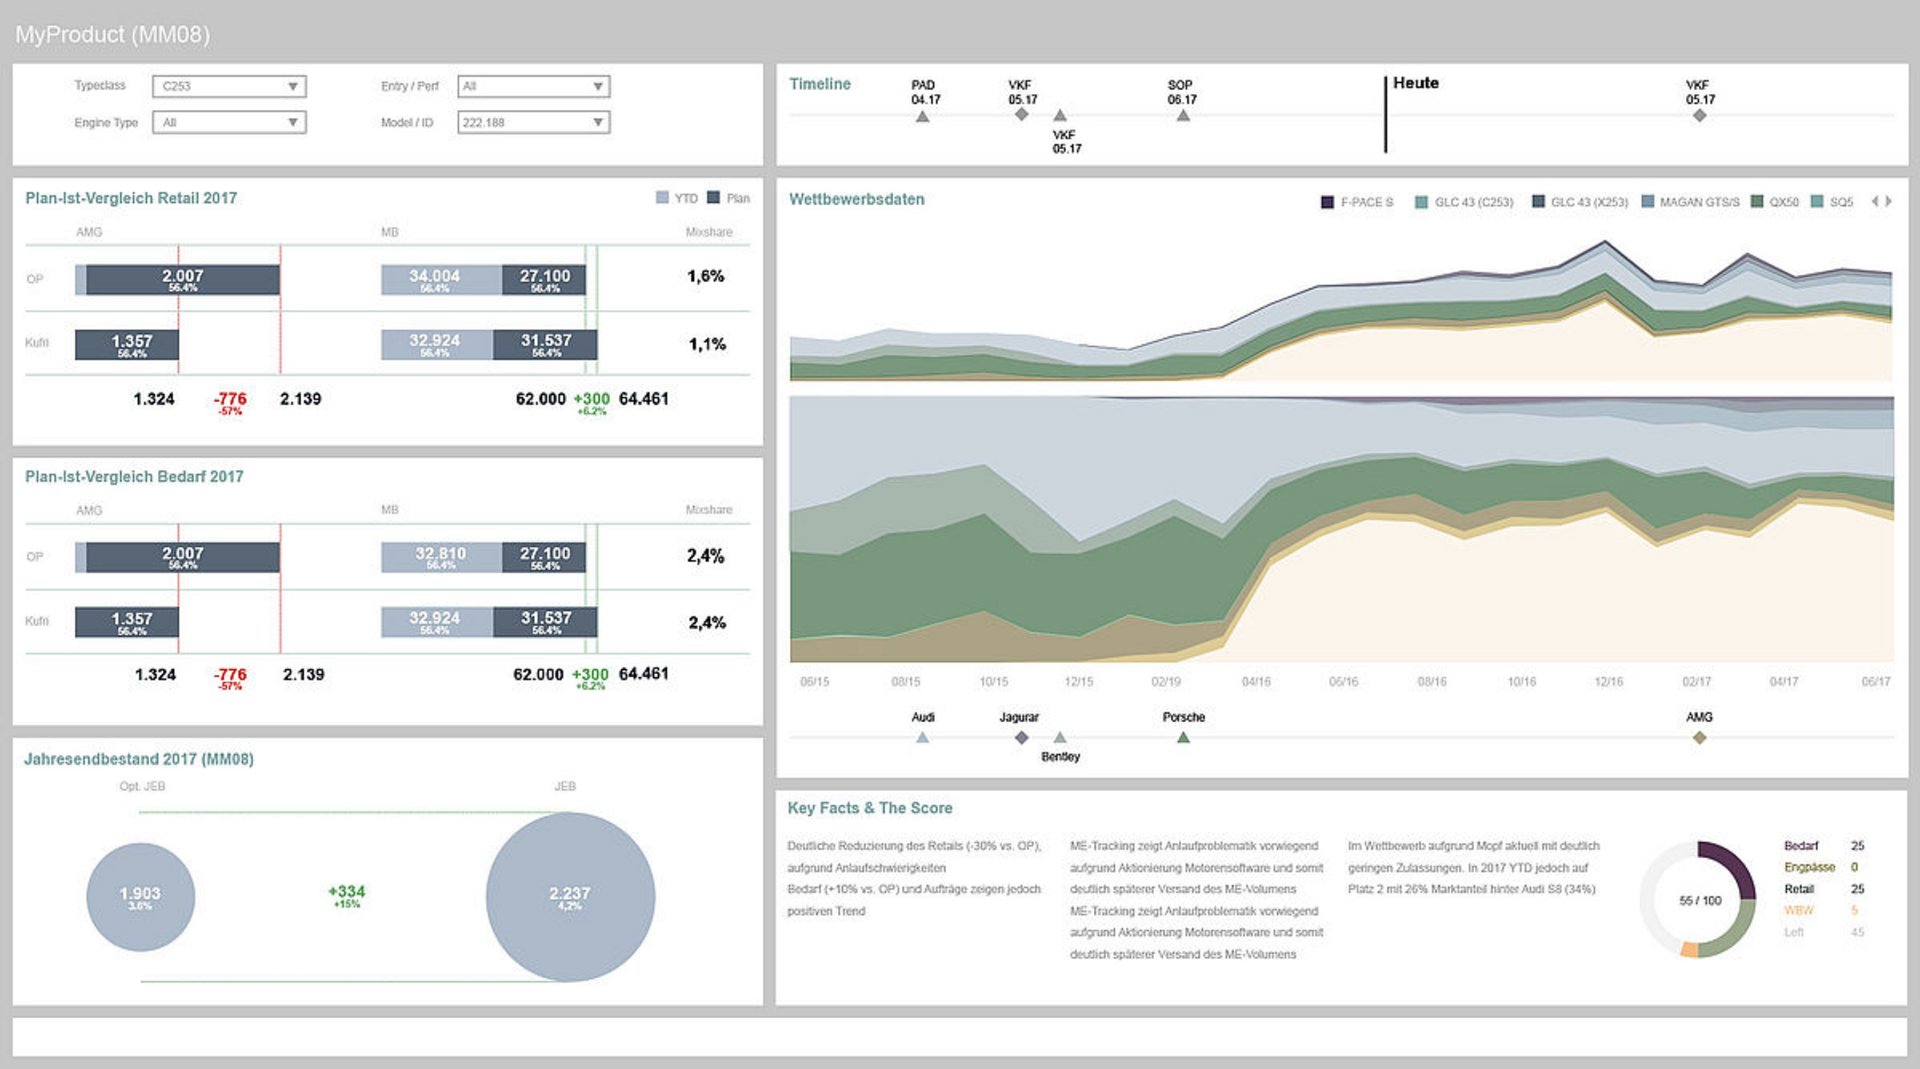
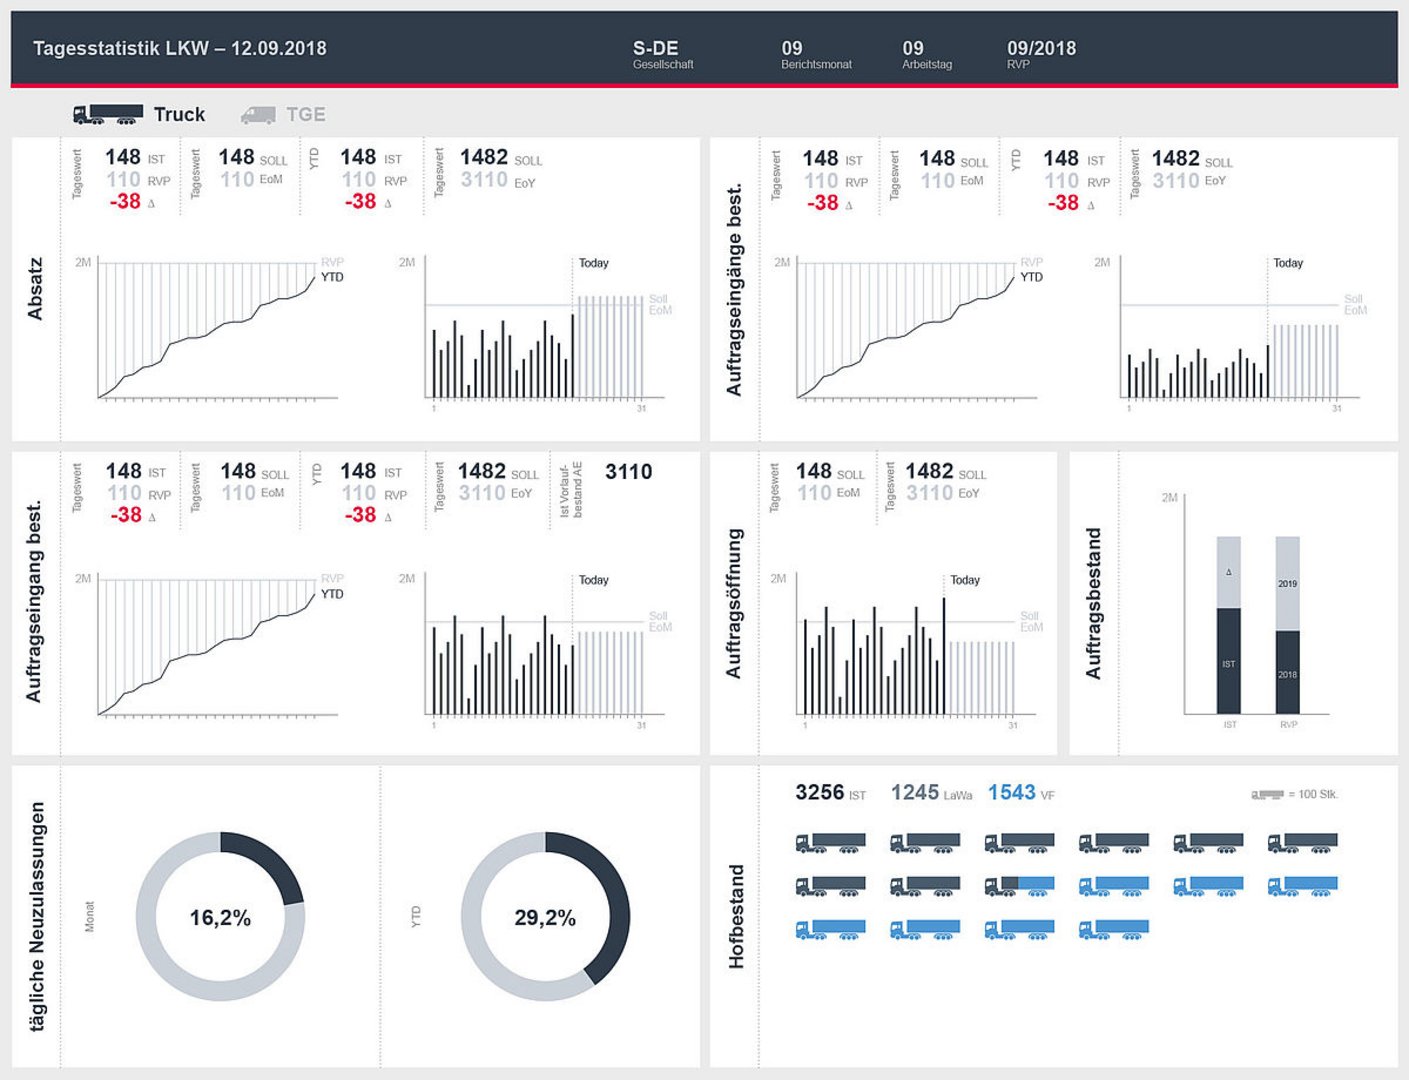
Some examples from our many years of work for well-known clients from various industries can be found here:
We can certainly develop the ideal Dashboard Design for you, aligned with the corporate identity of your company. Contact us and give your reporting system the decisive visual and functional polish.