

A professional article by our colleague Lorela Ferhati
Lorela Ferhati, Business Intelligence Consultant in the M2 NextGen BI Team, is responsible for the visual design of various clients' projects. Lorela possesses a unique combination of skills, knowledge, and expertise in both areas data and design. With her visually appealing and engaging graphics, she's not only effectively communicating the message and goals of her clients but also inspires others with her visualizations: Lorela has been featured as one of the best and brightest authors on Tableau Public in 2021.
A dashboard, like any other type of visualization, can be well-designed or the complete opposite. It usually represents the primary goal of data visualization which is to communicate information clearly and effectively. By representing data visually, it becomes easier to identify patterns, trends, and outliers, which may not be immediately apparent in the raw data. This helps people to understand and interpret data more quickly and accurately, which is essential in decision-making.
‘The greatest value of a picture is when it forces us to notice what we never expected to see.’ (John W. Tukey)
Everyone who wants to create a dashboard, regardless of the tool, has in mind that the process of getting there is not always so easy. Why? It takes some effort to conceptualize everything from the smallest idea to the final output, often containing many steps.
Traditionally, the steps that people go through to create a dashboard start with, are:
-
Analyzing the requirements
-
Getting and shaping the data
-
Exploring the data
-
Analyzing the data
-
Development
Is any step missing? From our experience, the answer is yes! The step that is missing is prototyping or so-called graphical mockup creation. If you start directly in the tool, there is the risk of providing a suboptimal result with information that is not advised and approved by the end user, creating misleading outputs, and not accessing what is needed.
Let’s deep dive into that…
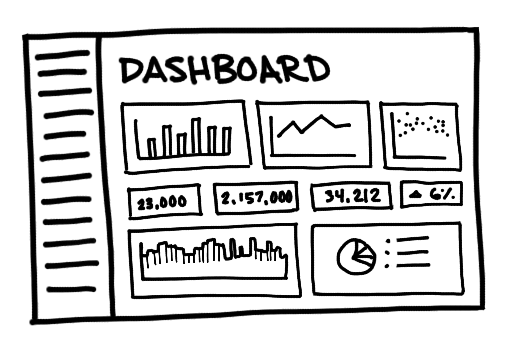
Prototype Design
A prototype is a product built to test ideas and changes until it resembles to the final product. You can mock-up every feature and interaction in your prototype as they should look in the final dashboard, evaluate if the idea still works, and make sure the requirements are being fulfilled. Shortly, it is an early sketch of a dashboard design.
'If a picture is worth a thousand words, then a prototype is worth a thousand meetings.' (Saying at IDEO)
Prototyping before building the dashboard brings some benefits:
-
It provides the client with a general idea of how the final dashboard and layout it's going to look.
-
It helps continuously brainstorm new ideas and encourages improvements.
-
It helps to build trust with the client.
-
It reduces risk and helps to avoid costly and time-consuming rework.
-
It increases productivity, team collaboration, and process consistency.
-
Having a prototype beforehand enables avoiding huge changes in the final layout.
-
Opens the path for iteration, reviews, and reusability.
At M2, we deal with dashboards every day and optimize them for our clients. The process of dashboard creation (for which you can use Tableau, PowerBI, etc.) always starts with designing the concept. And that means, before developing the dashboard directly in the visualization tool we first create the prototype. To do that we use Adobe Illustrator or Figma.
Let’s focus a little bit more here...
Figma and Prototyping
Figma is a cloud-based design and prototyping tool used for creating user interface (UI) designs, prototypes, and collaborative workflows. It is widely used by designers, product managers, and developers to create and collaborate on high-quality digital designs for web, mobile, and other platforms.
This powerful and versatile platform provides a range of design features such as vector networks, responsive design components, and interactive elements such as animations, transitions, and hover effects.
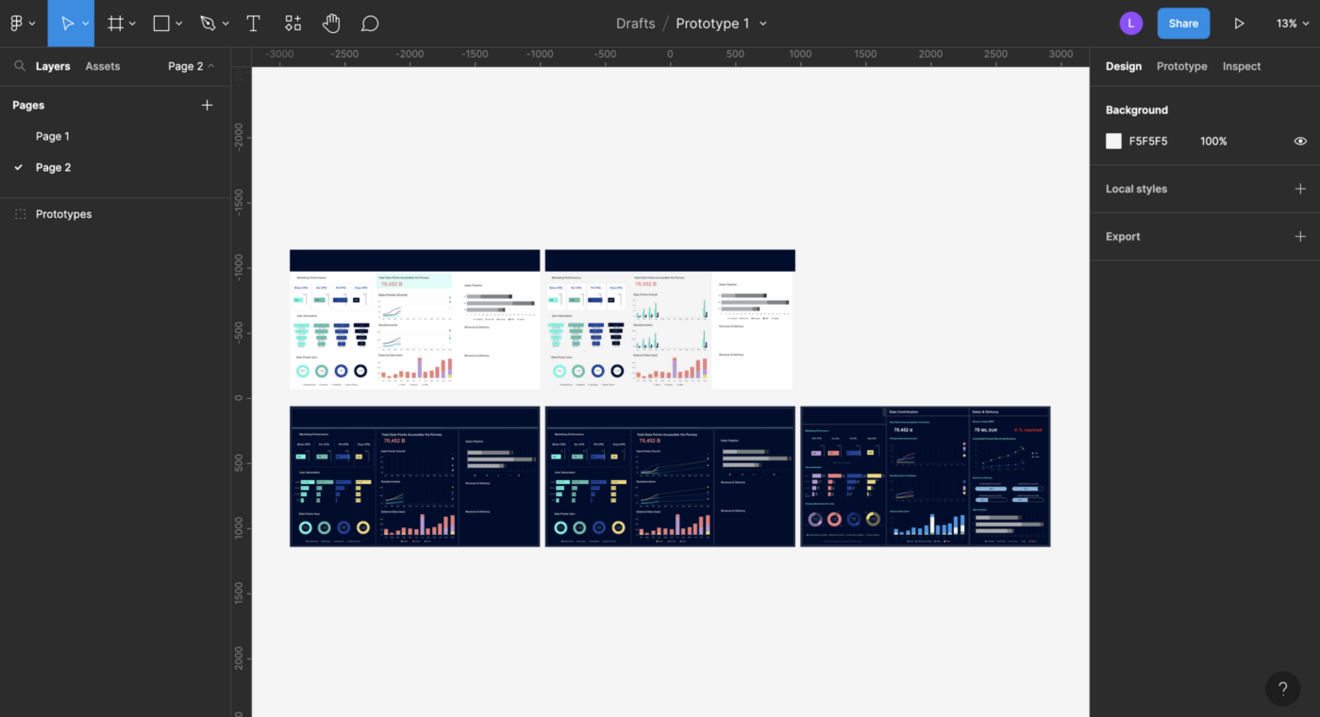
M2 Prototype dashboards in the process (Figma interface)
We chose Figma because of the advantages that it brings, such as:
-
It is a collaborative design tool. This means that many people can view and edit at the same time.
-
It is platform agnostic, which means it can be accessed on any device with a web browser, making it easy to share and collaborate on designs.
-
Prototyping functionality: Figma has built-in prototyping functionality, which allows you to create interactive prototypes of your designs quickly and easily.
-
It offers free download of the desktop app and therefore free access.
-
It is easy to use and offers an easy way to share and export different kinds of files.
-
There is a ready-made UI kit for Tableau
Key factors of effective prototype
To create a good prototype for a Tableau dashboard, it is essential to consider the unique needs and requirements of the client. Some essential factors include:
-
Ensuring the prototype clearly and effectively communicates the purpose and functionality of the dashboard. It should be easy to understand and navigate.
-
Including relevant data and insights which important to the client. Adhering to their business logic, the final dashboard should help them make data-driven decisions.
-
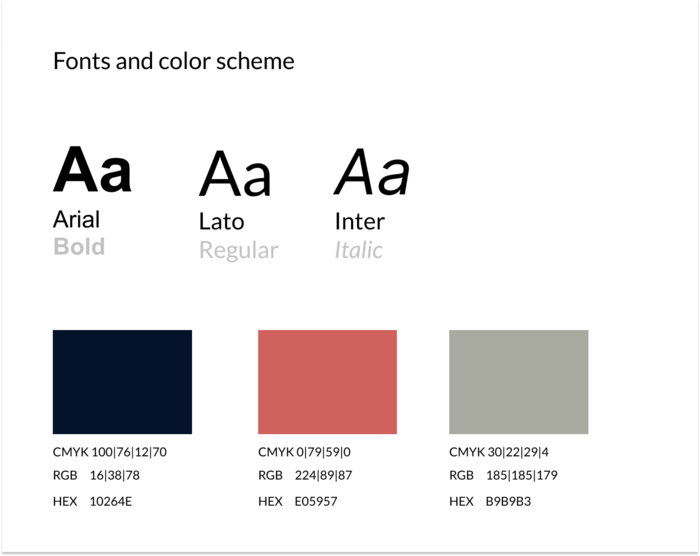
The prototype should have a clear and visually appealing design, that most of the time is required to match the corporate design. This will help the client envision how the final dashboard will look and feel.
-
Making it interactive and allowing the client to explore and interact with the data in a way that feels natural and intuitive.
-
Ensuring the prototype is realistic and representative of the final output.
-
Taking the client's feedback into consideration and proactively integrating it into the design process at every stage.
Key Considerations for the Implementation Phase
Before starting the development in Tableau make sure the clients agreed on the final design and you are ready to go.
When implementing a prototype in Tableau, keep in mind that it is very important to create the dashboard as close as possible to the design. To achieve that make sure that you have a data source that contains the data you need to visualize in Tableau. But not only that! Do check if the data is in the right shape, otherwise it might create a huge amount of unnecessary work.
To achieve a dashboard as close as it is designed do consider using the same color scheme, font, and layout to ensure consistency across the two platforms.
by: Lorela Ferhati
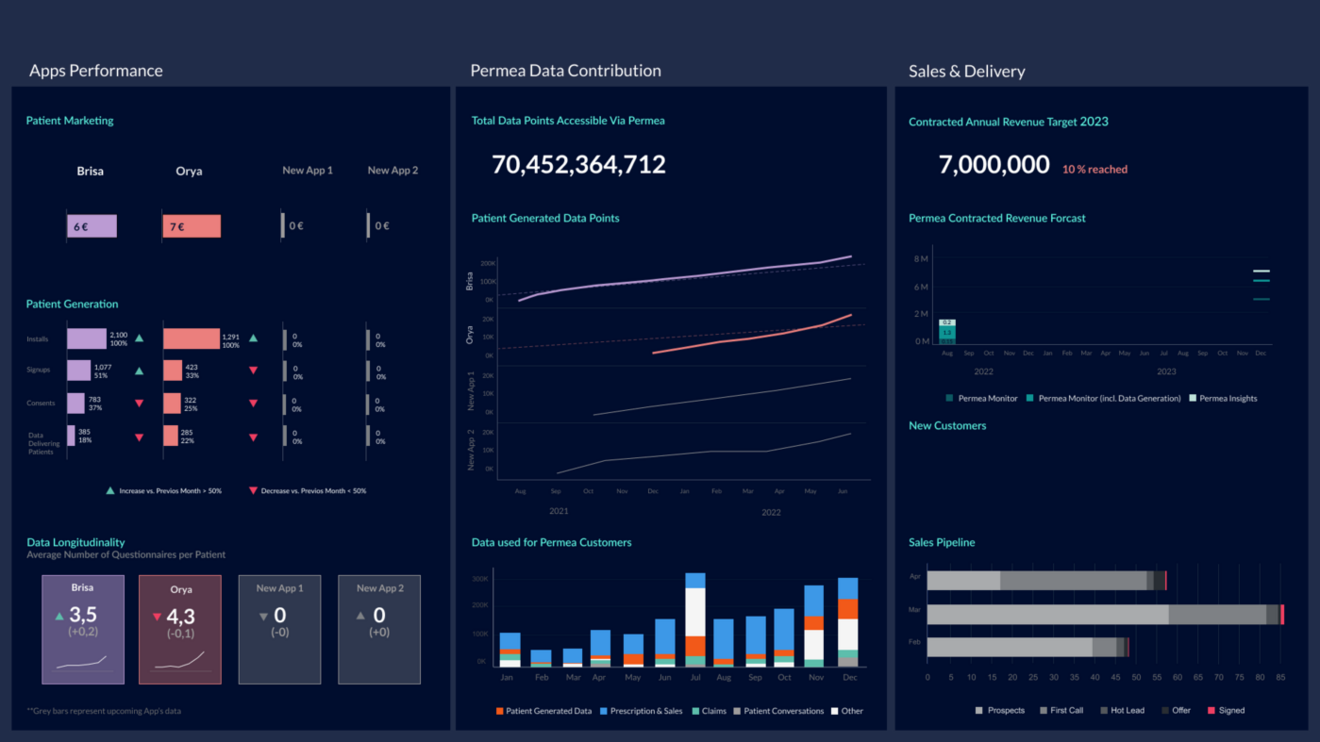
An important step is making sure the navigation of the Tableau dashboard is intuitive and easy to use, just like the prototype. Clients should be able to easily find the information they need and move between different views. Do not forget the interactivity features which make the Tableau dashboard more engaging based on the agreement with the client.
Last but not least, testing! Test the Tableau dashboard thoroughly to make sure it works as expected and meets the requirements of the Figma prototype. This will help ensure that the client has a positive experience when using the dashboard.
Now, test yourself and find the differences between this prototype build in Figma and the dashboard in Tableau.

Preparing for Potential Issues: Addressing What Could Go Wrong
In the best scenarios the dashboard development in Tableau looks like the prototype, but this might not be always the case. There are some potential challenges to keep in mind during the implementation phase, for example, data issues, design inconsistencies, navigation and interactivity complications, or performance problems.
To avoid these potential issues, it's important to test the Tableau dashboard thoroughly and address any problems as they arise. Some tips to avoid these issues are: Start with a clear plan, check the data thoroughly if it is in the right shape and includes all the variables you need, focus on the user experience, get feedback from clients now and then, and test, test, test!
Creating a dashboard involves various steps such as analyzing requirements, data analyzing, and data visualization. However, it is crucial not to overlook the importance of prototyping or creating a graphical mock-up design before starting with the final output and bringing value to the client’s needs.
An article by Lorela Ferhati
Do you have any questions about this article or about M2? Then please feel free to contact us at any time. We look forward to exchanging ideas with you.
Your M2 Team
Phone: +49 (0)30 20 89 87 010
info@m2dot.com