
- Data Analytics
- Visual Design
Sie kennen Tableau, aber Ihnen fehlt der Einblick in ein nachvollziehbares Anwendungsbeispiel? Unsere Consultants geben Einblicke in Kundenanforderungen und Lösungen. Dieses Mal: ein Fachartikel von unserer geschätzten Kollegin Neeha Hammad.

Neeha Hammad, Junior Data Engineer & Consultant im M2 Data Science Team, ist eine unserer Tableau Spezialist*innen. In ihrem Fachartikel zeigt sie, wie kundenspezifisches Geocoding in Tableau funktioniert, gibt reale Anwendungsbeispiele und erklärt die Geocoding Lösung von M2, die bei diversen Kund*innen eingesetzt wird.
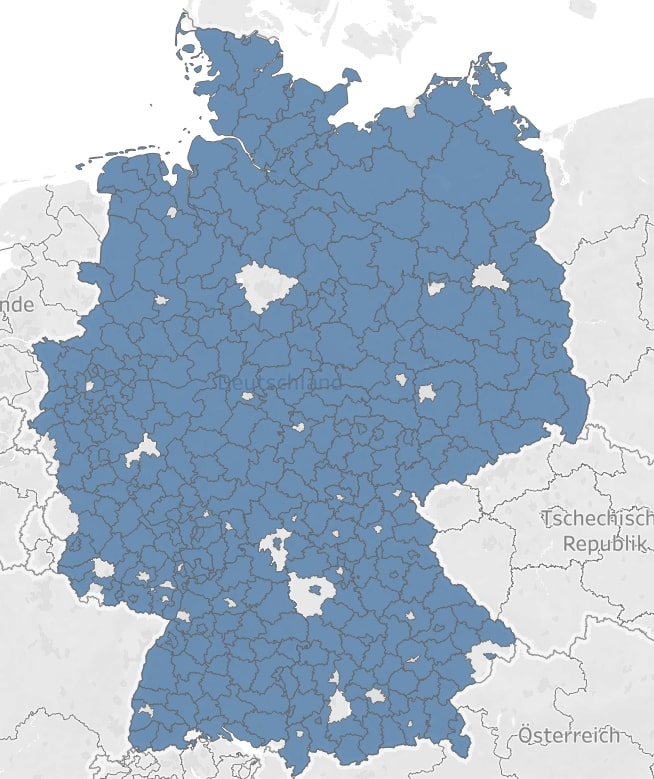
Tableau is a visualization tool that allows users to visualize various types of data, including geographical data. One of Tableau’s features is Tableau Maps, which can be used to visualize shapes, data points, or geographic lines. For example, points could represent buildings, shapes could represent countries, while lines could represent roads or highways. As an example, here is a shape map of Germany displayed in Tableau Maps:
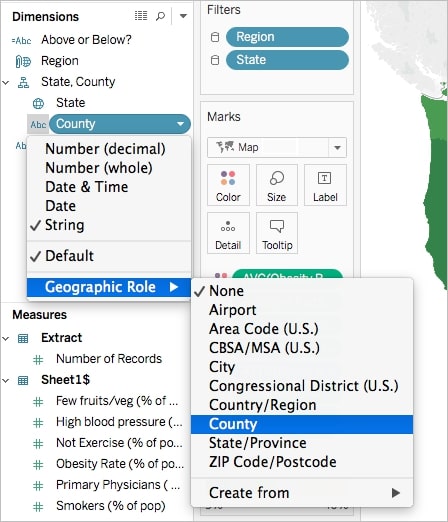
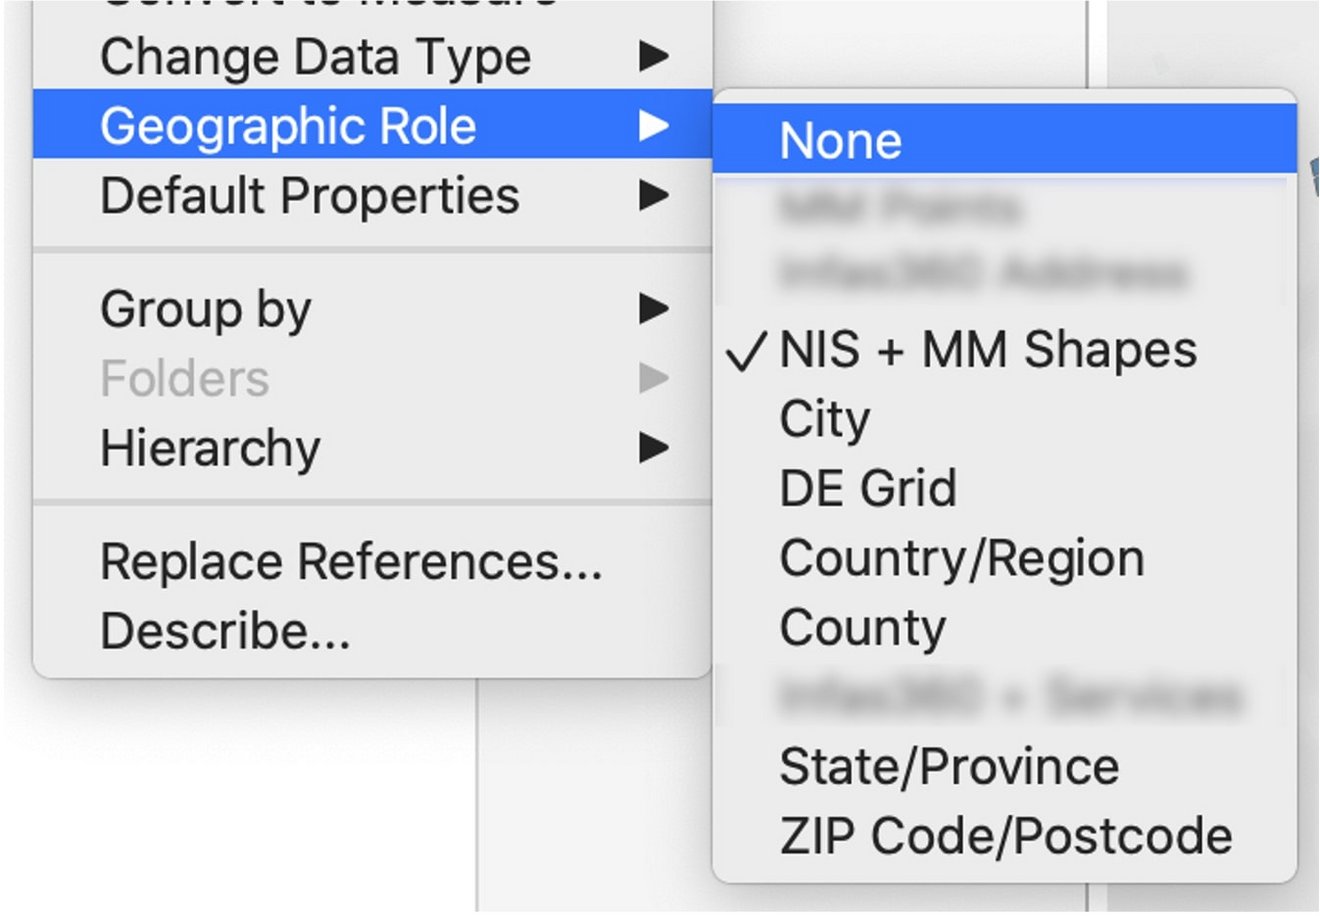
To visualize a shape or point on Tableau’s map, you need to assign it a geographic role (also known as georole). This assignment is done based on your data type. For example, if you want to visualize different zip codes, you will select the Zip Code georole.
Apart from the default Tableau georoles like cities, countries, or provinces, it is also possible to use custom georoles in Tableau. With custom georoles, users can define their own geographical regions.
Custom Geocoding can be quite useful for various industries. From logistics companies to transportation ones, most businesses divide their customer pools into different geographic regions. Such divisions are done to facilitate easier marketing, deliveries, sales, as well as customer services. By visualizing custom defined geographic regions, companies can monitor regions on a more granular level and use critical information for data analysis. For example, given the right data, data analysts can use Tableau’s interactive maps to evaluate a particular region’s population, average income, and other related demographics. The findings from such data analysis can then be used to make better data-driven decisions.
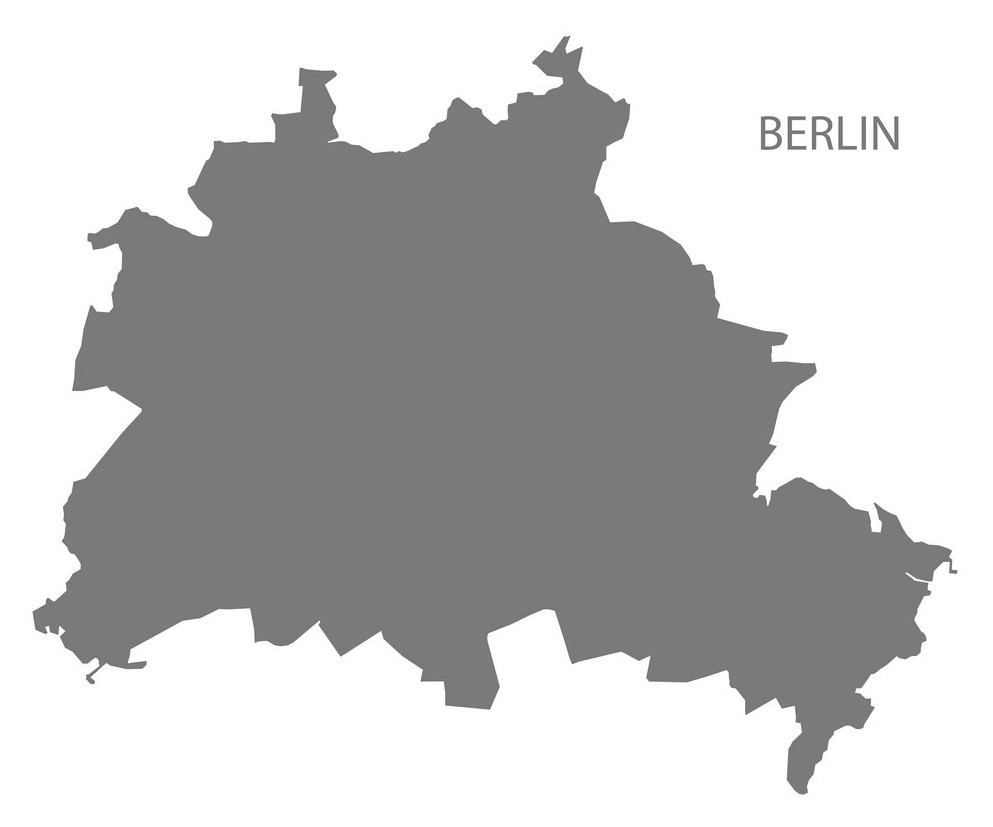
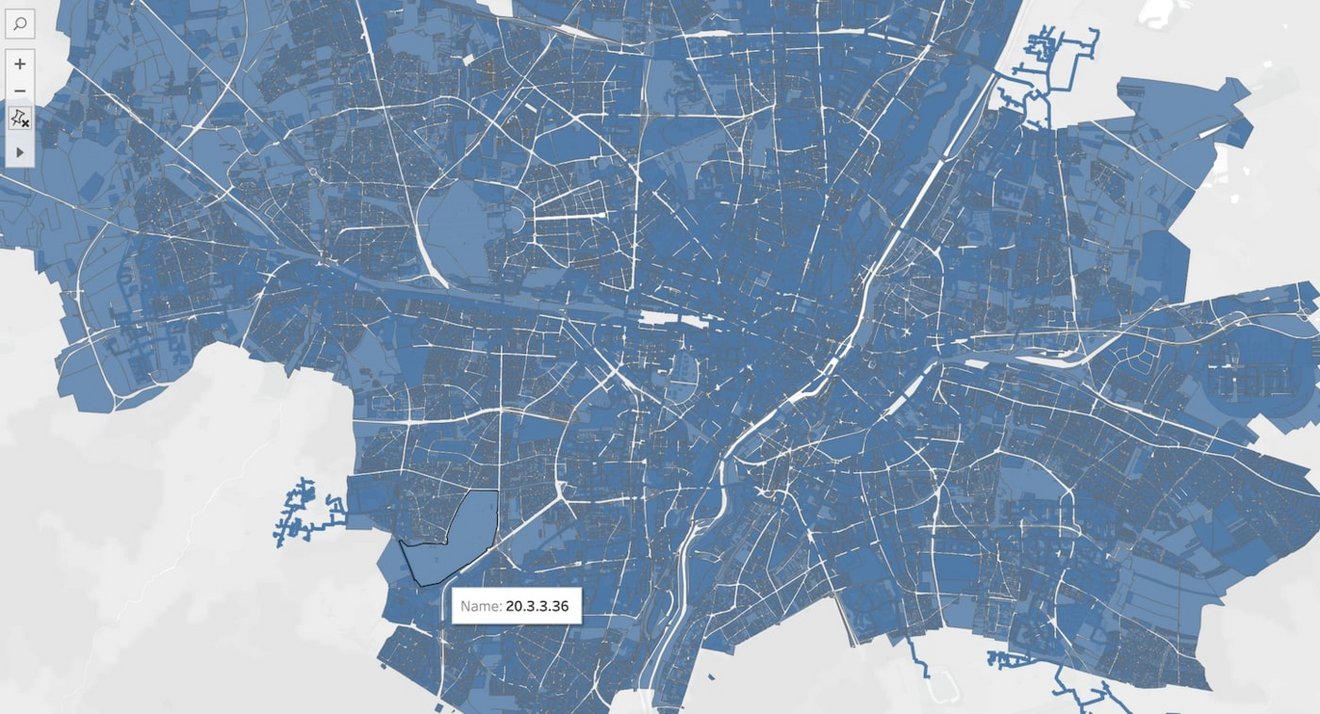
As an example, we recently helped one of our clients develop custom georoles so that they could visualize the different regions of Berlin (Charlottenburg, Mitte, Kreuzberg, Prenzlauer Berg etc). Before assigning georoles, you would see something like this for Berlin:
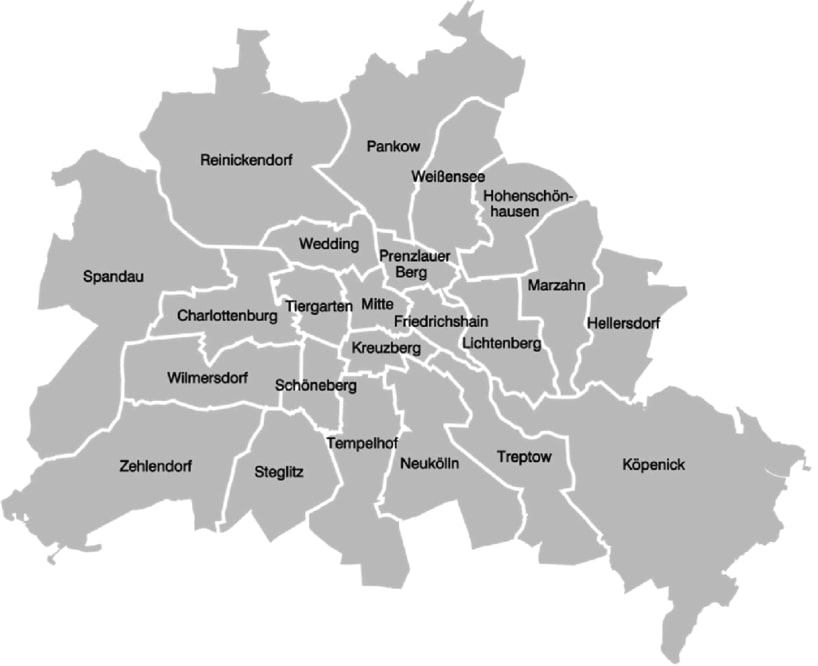
However, after using custom georoles, you can also visualize Berlin on a more granular level like this:
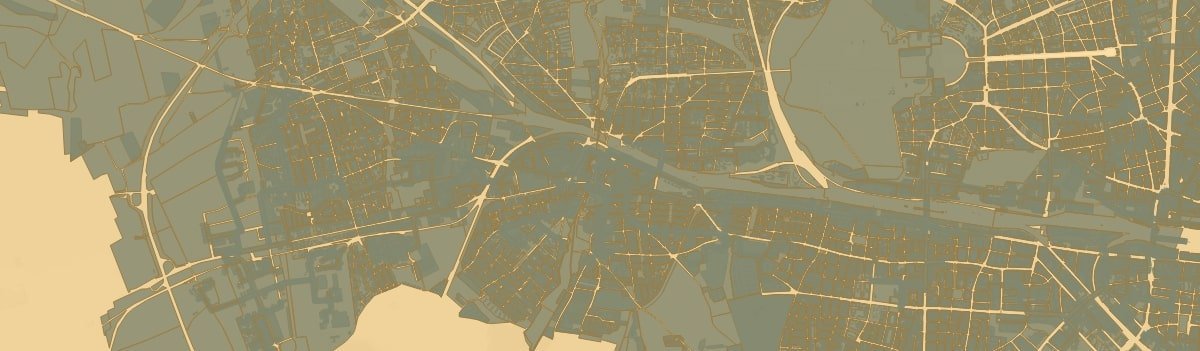
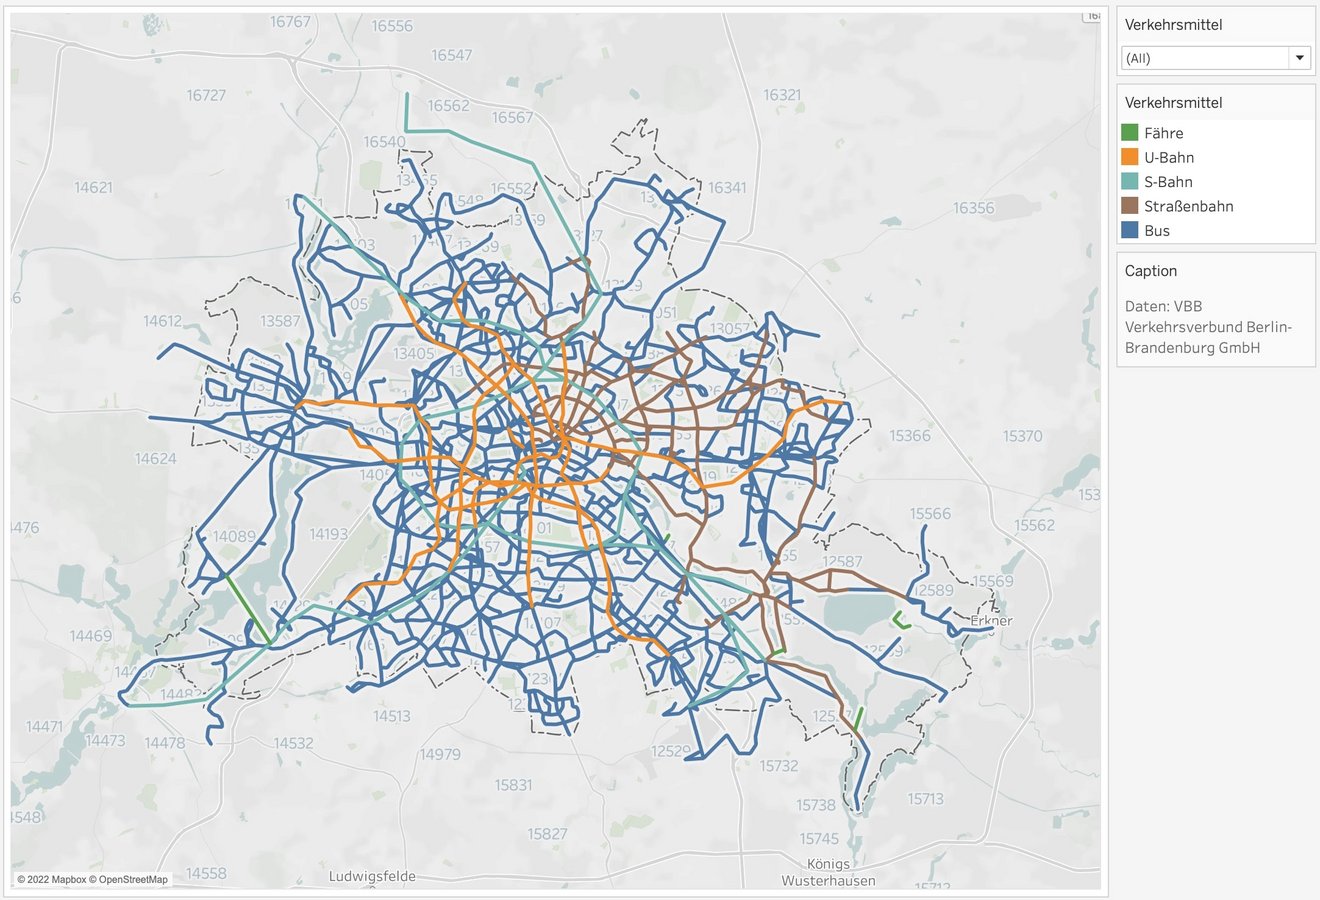
Similarly, another client wanted to have georoles for all the German highways. Another potential use case could be to visualize all public transport networks of a city. For instance, the map below shows the public transport (S-bahn, U-bahn, tram etc.) routes of Berlin.
Other possible use cases could include the intelligence agencies dividing a city into different zones according to the responsible head police station or on the basis of crime-sensitive locations. Military Grid Reference Systems could be another example use case for custom georoles.
Now that we have looked into some of the potential use cases, let’s explore how we can actually use georoles. To visualize a field on Tableau‘s map, we first need to assign it a geographic role based on its location type.
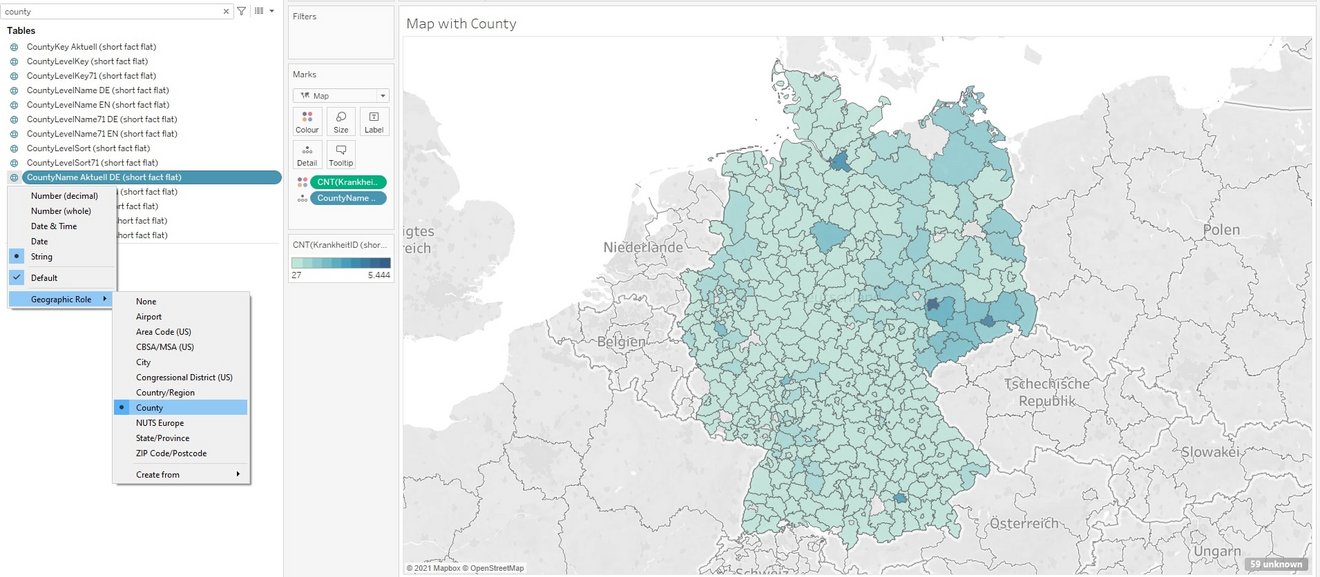
Once this is done, you will be able to see something like this:
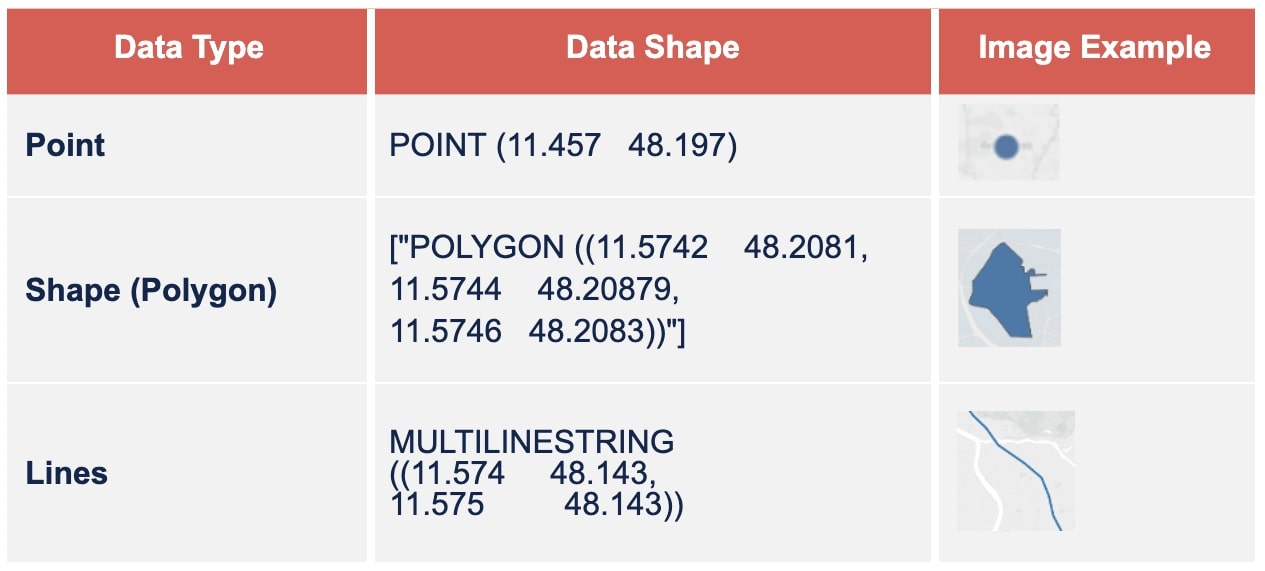
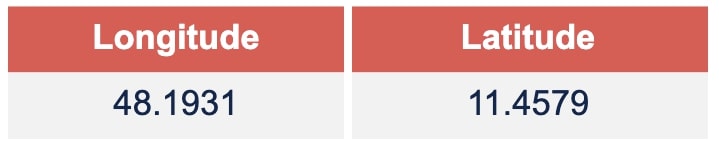
Each data type is referenced by a set of coordinates (longitude/latitude values) at Tableau’s backend. This is how the data shapes look like at the backend (server side) and frontend (user interface):
When a user selects a georole, the georole assigns longitude/latitude coordinate values to each value in their selected column field. This happens at Tableau’s backend.
We at M2, created a custom geocoding solution for Tableau. We used Python and HyperAPI to manipulate Tableau’s backend such that our clients can use custom georoles to visualize geographic regions as per their requirements.
Although Tableau developers can also perform custom geocoding manually, our solution will simply help them save a significant amount of time. If developers perform custom geocoding manually, they will have to load multiple datasets from flat files and perform joins on the basis of ids, names, and geographic coordinates each time. However, with our solution, the required data is already present at the backend and can be used hands-on.
Apart from saving time, our backend solution has also proven to have an enhanced speed and performance as compared to when geocoding is performed manually using the frontend. The solution can easily be rolled out for all employees using Tableau server as well as Tableau Desktop versions.
Sie haben Fragen zu diesem Artikel oder zu M2? Dann kommen Sie jederzeit gern auf uns zu. Wir freuen uns auf den Austausch mit Ihnen.
Ihr M2 Team
Telefon: +49 (0)30 20 89 87 010
info@m2dot.com · M2@Facebook · M2@Twitter · M2@LinkedIn · M2@Instagram

How to create better dashboards using prototyping in Figma
Weiterlesen
Individuelles Geocoding, Anwendungsbeispiele und unsere Lösung
Weiterlesen